


It is recognised that reducing average salt intake from current high levels (8–9 g/person per d), and specifically reducing the salt (Na) content of processed foods, should have a significant impact on reducing the number of myocardial infarctions and strokes in Australia( Reference Goodall, Gallego and Norman 1 ). Australia is a member of the WHO Member States who have agreed on a voluntary global non-communicable disease target of a 30 % relative reduction in mean population intake of salt, with the aim of achieving less than 5 g salt/d (approximately 2 g Na/d) by 2025( 2 ).
Utilising 24 h dietary recall methodology, the 2011–12 Australian Health Survey indicated an average salt intake of 7·1 g/d for males and 5·4 g/d for females( 3 ) which is lower than the average salt intake of 9·2 g/d for males and 6·7 g/d for females as measured by 24 h urine collections in over 300 people in a recent population-based study( Reference Nowson, Lim and Grimes 4 ). The difference in estimated intake of salt between the two methods may relate to the inability of dietary recall to capture the amount of discretionary salt used and the restricted range of foods included in food databases, which prevents analysis that captures all the variations in salt content of different brands of manufactured foods. Dietary assessment does, however, provide valuable information on the relative contributions of different foods to total Na intake, as in developed countries manufactured foods have been estimated to contribute at least 70 % of the daily amount of salt consumed( Reference James, Ralph and Sanchez-Castillo 5 – Reference Harnack, Cogswell and Shikany 7 ). Data from the Australian Health Survey in adults, using a 24 h dietary recall, indicated that the major dietary sources of Na are cereal-based products and dishes (25 %; mainly from the mixed dishes where cereal is the major ingredient, e.g. pasta dishes), cereal and cereal products (18 %; mainly bread) and meat and poultry (18 %; mainly processed meat and mixed dishes)( 3 ). In addition, it is recognised that restaurant meals, takeaway foods and convenience foods contain relatively high concentrations of Na( Reference Garcia, Dunford and Sundstrom 8 ). In New Zealand an assessment of the commonly consumed fast foods in the national dietary survey of 2008/9 indicated that the majority exceeded the Na targets set by the UK Food Standards Agency in 2012( Reference Prentice, Smith and McLean 9 ). In addition many discretionary foods (which are energy-dense and nutrient-poor), such as processed meats and sausages, savoury pastries and pies, commercially fried foods, potato chips, crisps and other fatty and/or salty snack foods, contain high levels of added salt( 10 ). The recent 2011–12 Australian Health Survey indicated that, on average, just over one-third (35 %) of total daily energy consumed was reported to be from discretionary foods( 3 ). Therefore, the frequency of consumption of these discretionary foods is likely to impact on the usual level of salt (Na) intake.
It is known that dietary patterns alter on weekends and holidays and it may be that more salt is consumed due to a different selection of food products. There is an indication that people are more likely to eat away from home and use pre-prepared convenience foods and takeaway foods at weekends( Reference McCarthy 11 ). In the Australian 1995 National Nutrition Survey, adults were found to have higher intakes of muscle meat and sausages on weekends( 12 ) and in the USA, weekend consumption has been associated with increased energy intake and poorer diet quality( Reference An 13 ). Given that Na intakes are well above dietary recommendations it is useful to consider if dietary Na intake differs between weekdays and weekends as this information can be used to tailor interventions that seek to alter eating habits and/or utilise Na reformulation targets. Therefore, we aimed to compare salt intake (measured by 24 h urine collection and dietary recall) and dietary sources of salt on weekdays and weekend days in a sample of Australian adults.
Methods
Participants were recruited from a sample of 3653 people (38 % response rate) participating in the Victorian Health Monitor survey (VHM; May 2009 to April 2010)( 14 ), for which the recruitment strategy and methods have previously been documented( Reference Nowson, Lim and Grimes 4 ). In 2011, a subgroup of 3487 people who participated in the VHM survey, lived within 100 km of a commercial pathology centre and who had a valid current address were invited to participate by letter in the present salt study. Participation involved provision of a 24 h urine collection, additional information on discretionary salt use and self-reported body weight, and participation in a telephone-administered interview providing a 24 h dietary recall over the telephone (utilising visual aids used in the previous VHM survey to estimate serving sizes). Of the 3487 adults who were sent letters of invitation to participate in the salt survey, 1003 people registered interest and provided telephone contact details. Of those who registered interest, 697 people were selected at random to participate to meet the sampling size criteria. This resulted in participation of 605 people (326 women, 279 men), representing 17 % of those who received invitations to participate. All participants provided written informed consent.
Participants recorded the start and end times for their urine collection and reported any missed urine collection during the 24 h period. Urine collections were considered valid if the collection time fell between 14 and 31 h and all urinary excretion results were standardised to a 24 h period. The 24 h urine samples were considered ‘weekend’ collections if the first void of the collection was on a Saturday or Sunday morning. The urine samples were received, processed and analysed by the Australian accredited pathology service centres of Healthscope and Dorevitch. Urinary Na and K concentrations were determined using ion-selective electrodes and urinary creatinine concentration was determined from the kinetic Jaffe reaction using the Advia 2400 Clinical Chemistry System (Siemens). Assessment of completeness of urine collections was made by assessing the predicted 24 h urine excretion of creatine based on age and gender( Reference Forni Ogna, Ogna and Vuistiner 15 ). In addition, criteria based on low urine volume (<500 ml), reported missed collections and extreme statistical outliers, which are similar to those previously utilised, were used to identify probable over- and under-collection of 24 h samples( Reference Land, Webster and Christoforou 16 ). Of the 605 participants, seven urine collections were excluded due to likely errors in collection: three women with 24 h creatinine <4 mmol/d, one man with 24 h creatinine >3 sd below the mean, two women with 24 h urine volume <500 ml and one woman who reported missing more than one void during the collection period, resulting in the final sample of 598 participants.
Demographic, anthropometric and dietary data
Demographic data and height measurements were obtained as part of the VHM survey. Height was measured to the nearest 0·1 cm without shoes using a stadiometer. Annual household income and highest level of education of the participant were self-reported in VHM and used as indicators of socio-economic status. Participants provided information on their current body weight, together with information on knowledge and attitudes to salt intake and salt use during cooking and at the table, during a telephone interview.
All participants received a shopping voucher to the value of $AU 20 or a double-pass movie ticket on completion of each 24 h urine collection, together with a summary of their individual results.
Participants completed one 24 h diet recall via telephone which was scheduled within 3 d of completing their 24 h urine collection (mean elapsed time=5·7 (sd 6·3) d; median=3 (interquartile range 1–8) d; range=1–31 d). A five-pass method was used to record food and beverage intakes on the day prior to the interview based on the method validated by the US Department of Agriculture( Reference Conway, Ingwersen and Moshfegh 17 , Reference Conway, Ingwersen and Vinyard 18 ). All participants were provided with a food model booklet to assist with estimating portion sizes( 19 ). The 24 h diet recalls were considered ‘weekend’ intakes if participants recalled the foods and beverages consumed on a Saturday or Sunday.
Low energy reporters were identified following the Goldberg cut-off method (ratio of energy intake (excluding dietary fibre) to BMR <0·9)( Reference Goldberg, Black and Jebb 20 ), with BMR estimated using the Schofield equation for the specific gender and age( Reference Schofield 21 ).
Foods and beverages reported by each participant in his/her 24 h diet recall were entered into FoodWorks 7 software (Xyris Software, Brisbane, Queensland, Australia) and nutrient intakes were estimated using the Australian food composition database AUSNUT 2007( 22 ). Dietary intake did not include discretionary salt or dietary supplements. We have presented the mean intakes of Na and other nutrients of the group, the proportion of energy sourced from macronutrients, Na and K density (milligrams per megajoule of energy), and the molar Na:K ratio. The food groupings specified in the AUSNUT 2007( 22 ) database were used to estimate the food contributions to dietary Na intake. The amount of Na (milligrams) contributed by each food group was divided by the mean dietary Na intake of the study sample, multiplied by 100 and presented as a percentage.
Statistical analysis
Participant characteristics are presented as mean and sd, mean and 95 % CI, or n and %. Comparisons were made using independent t tests and χ 2 tests for continuous and categorical variables, respectively. Subgroup analyses by gender were completed to assess gender differences. To compare bivariate, continuous associations, we used Pearson’s correlation. Age-adjusted residuals were derived from regression analysis for men and women separately. A P value of <0·05 was considered significant, throughout. Data were analysed using the statistical software package Stata/SE version 14.1.
Results
There were 598 participants, about half of whom were women (Table 1). Twenty-five women and twenty-nine men were identified as having potentially implausibly low energy intakes (9·2 % of sample). The twenty-five female under-reporters had energy intakes 47 % lower than the rest of the women (4474 kJ/d compared with 8449 kJ/d) and the twenty-nine male under-reporters had energy intakes 48 % lower than the rest of the men (5693 kJ/d compared with 11 031 kJ/d). A sensitivity analysis was conducted which included these fifty-four potential under-reporters, which did not change the results in any meaningful way: mean salt intake of the sample was 7·1 (sd 0·1) g/d when these fifty-four participants were excluded and 6·8 (sd 0·1) g/d when they were included (P=0·283). Importantly, there was no difference in the proportion of under-reporters on weekend days compared with weekdays (under-reporters: 9·3 % on weekdays v. 8·0 % on weekend days; χ 2 P=0·661), therefore all participants were included.
Table 1 Demographic characteristics, dietary electrolyte intake and 24 h urinary excretion of electrolytes in community-dwelling adults (n 598) living in the State of Victoria, Australia, 2011Footnote *,Footnote †
* Categorical variables presented as n and %; continuous variables presented as mean and 95 % CI.
† Electrolyte excretion from one 24 h urine collection; dietary intake from one 24 h diet recall.
‡ P value for the difference between women and men. Gender differences in categorical variables compared using the χ 2 test; gender differences in continuous variables compared using the independent-samples t test.
§ Self-reported weight.
║ Grams of salt=mmol Na × 23 × 2·54/1000.
The average salt intake assessed from the 24 h diet recall was approximately 16 % lower than that assessed from the mean 24 h urine excretion (Tables 1 and 2). There was a significant modest correlation between dietary intake and urinary excretion of salt (r=0·343, P<0·001). Men reported consuming more energy (+2·5 MJ/d; 24 h recall) than women and men reported and excreted more salt than women, and these gender differences in energy intake and salt excretion remained even after adjustment for body weight (reported dietary salt intake: men 7·6 (95 % CI 7·2, 8·1) g/d v. women 6·1 (95 % CI 5·7, 6·5) g/d, P<0·001; 24 h salt excretion: men 9·0 (95 % CI 8·6, 9·3) g/d v. women 7·3 (95 % CI 6·9, 7·6) g/d, P<0·001).
Table 2 Nutrient intakes of community-dwelling adults (n 598) living in the State of Victoria, Australia, 2011Footnote *
%E, percentage of energy.
* Dietary intake from one 24 h diet recall.
The mean 24 h salt excretion in this group was 8·1 (95 % CI 7·8, 8·3) g/d. Participants who performed their urine collection on a weekday compared with a weekend day were on average 4·0 (95 % CI 1·9, 6·1) years older (weekday: 58·3 (95 % CI 57·2, 59·4) years v. weekend day: 54·3 (95 % CI 52·5, 56·1) years), but there were no differences by gender or body weight. There were no differences in the age, gender, body weight or BMI of participants who reported weekday intakes in their 24 h recall compared with those who reported weekend day intakes. Overall, reported dietary salt intake and 24 h urinary excretion (adjusted for age) were higher on weekend days (Saturday and Sunday) compared with weekdays (Table 3). The mean reported dietary salt intake was 0·9 g/d (14 %) higher on weekend days and age-adjusted urinary salt excretion was 0·8 g/d (8 %) higher on weekend days compared with weekdays. When split by gender, the difference in salt excretion between weekdays and weekend days was no longer statistically significant. There was an indication of a 6 % greater intake of energy on weekend days (P=0·06) but Na density did not differ between weekdays and weekends. For men only, there was a 16 % greater reported salt intake on weekend days, but no difference in energy intake.
Table 3 Dietary and urinary sodium/salt on weekdays compared with weekend days in community-dwelling adults (n 598) living in the State of Victoria, Australia, 2011
* Unpaired t test for difference weekday v. weekend.
† t Test specifying unequal variance.
‡ Grams of salt=mmol Na × 23 × 2·54/1000.
§ Urinary salt adjusted for age (unstandardised predicted value).
The major food sources of Na were cereals and cereal products (19 %) which included breads and bread rolls (13 %). This was followed by meat and poultry (16 %), then cereal-based products and dishes (15 %), milk products (11 %) and gravy and sauces (11 %), which in total accounted for 71 % of dietary Na. Most of the Na within the meat and poultry group (contributing 16 % of total Na) came from processed meats (8 %) including ham (4 %) and bacon (2 %). Within the cereal-based product group, the major sources of Na were savoury rice-based dishes (2 %; fried rice, risotto and sushi), pizza (1 %) and pasta and noodle dishes (1 %). Of the cheeses, combined regular and reduced-fat natural, traditional cheese (category includes cheddar, feta, mozzarella) contributed the most Na (4 %) followed by processed cheese (2 %). Overall, the gravies and savoury sauces group provided 8 % of total Na and, within this group, the major contributor to Na was savoury sauces (6 %), of which soya sauce contributed to 3 %. Other foods contributing ≥1 % of Na intake included stock cubes (2 %).
When the contribution of different food groups to total dietary Na consumed on weekdays and weekends was assessed, there was some indication, although not significant, of a greater contribution of gravies and savoury sauces, processed meat, mixed dishes where cereal is a major ingredient, seasonings and stock cubes to total Na on weekend days compared with weekdays, together with a reduced contribution from plain breads (Fig. 1). There was some indication for more Na to be consumed from the meat group on weekends (+149 mg, P=0·053), with 96 mg Na more from processed meat (P=0·088), compared with weekdays (Table 4).
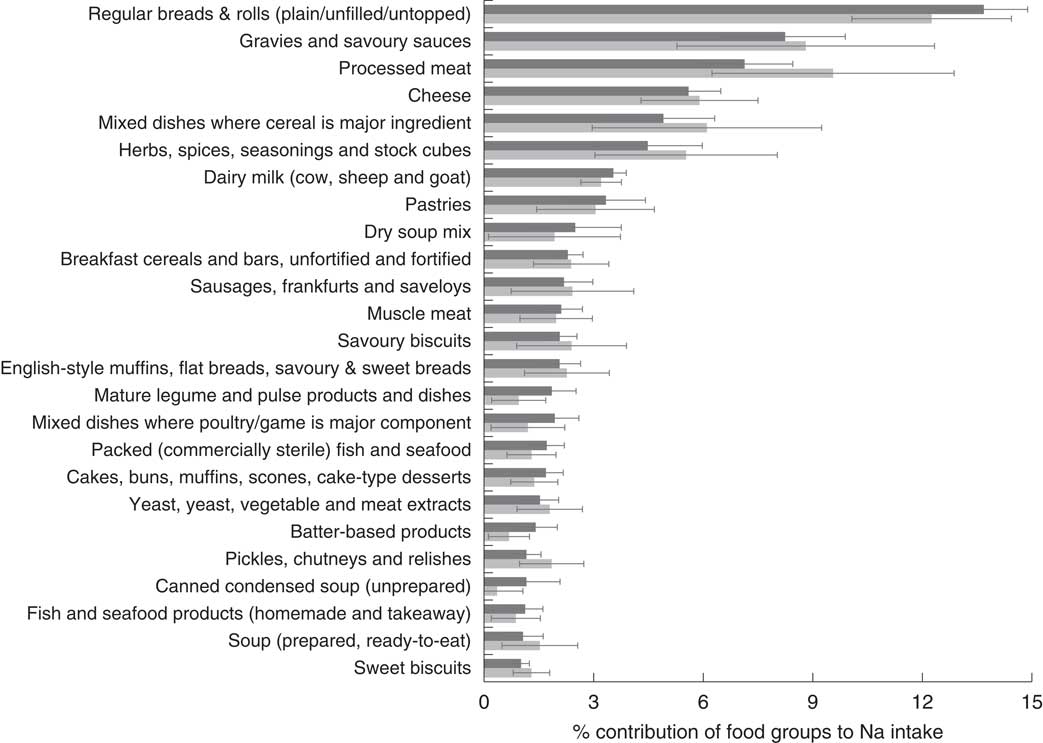
Fig. 1 Main food sources of sodium (salt) by weekday (![]() ) and weekend day (
) and weekend day (![]() ) in the diet of community-dwelling adults (n 598; 53·5 % women; mean age 57·1 (95 % CI 56·2, 58·1) years) living in the State of Victoria, Australia, 2011. Percentage contribution (with 95 % CI represented by horizontal bars) of food groups* to sodium intake by type of day. *Foods are categorised according to AUSNUT 2007 (3-digit code level). Only foods contributing ≥1 % are presented
) in the diet of community-dwelling adults (n 598; 53·5 % women; mean age 57·1 (95 % CI 56·2, 58·1) years) living in the State of Victoria, Australia, 2011. Percentage contribution (with 95 % CI represented by horizontal bars) of food groups* to sodium intake by type of day. *Foods are categorised according to AUSNUT 2007 (3-digit code level). Only foods contributing ≥1 % are presented
Table 4 Major food group sources of dietary sodium (n 598) in the diet of community-dwelling adults (n 598) living in the State of Victoria, Australia, 2011
* Food groups are presented at the 2-digit code level, with the 3-digit code level presented in italics and the 8-digit code level presented in bold italics (only for soya sauce).
† Unpaired t test.
Discussion
Overall dietary salt intake was 8–14 % higher on weekends (Saturday and Sunday) compared with weekdays as measured by 24 h excretion or 24 h dietary recall, respectively. The top five major dietary sources of Na in this sample were similar to those found in the national 2011–12 Australian Health Survey( 3 ). Both surveys indicated that more than 70 % of dietary Na (74 % in the national survey and 71 % in the present survey) was derived from five major food group categories: cereal-based products and dishes; cereals and cereal products; meat and poultry and game products and dishes; milk products and dishes; and sauces. Most of the Na within the meat and poultry group came from processed meats, including ham and bacon. This highlights the importance of ensuring that clear Na reduction reformulation targets are specified for these foods if the Australian population is to achieve a 30 % reduction in Na intake by 2025. It has been estimated that a 35 % reduction in total population salt intake could be achieved by a 36 % reduction in the Na content of packaged foods in conjunction with a 40 % reduction in discretionary salt use and the Na content of foods consumed away from home. This range of reductions would result in the population meeting the WHO target for a 30 % reduction in dietary salt( Reference Eyles, Shields and Webster 23 ). Currently, progress in reducing the Na content of key food items in Australia has been slow. A recent analysis of the change in the Na content of pasta sauces available and the impact of the Food and Health Dialogue Na target for this product indicated that the average level of Na was above the 2012 UK target and that manufacturers would need to reformulate pasta sauce products well beyond the Food and Health Dialogue target to achieve a meaningful reduction in Na content( Reference Trevena, Dunford and Neal 24 ). Furthermore, although there appears to have been a small fall in the Na content of fast foods produced by large fast-food chains between 2009 and 2012( Reference Garcia, Dunford and Sundstrom 8 ), the average Na content per serving remained high at 1·5 g salt/serving.
Although there was an indication, which did not reach significance, of a slightly greater intake of energy (7 %) on weekend days compared with weekdays, Na density did not differ at weekends. Men particularly appeared to consume more salt on weekend days (18 % greater dietary salt intake compared with weekdays). Therefore, it appears that the higher salt intake at weekends could be due to a small increase in food intake combined with a small shift in the range of processed foods eaten. Although individually not significant, there were small shifts in specific food groups with more Na being derived from gravies and savoury sauces, processed meat, mixed cereal dishes, seasonings and stock cubes on weekend days compared with weekdays. As these flavouring and seasoning agents (gravies, savoury sauces, stock cubes) typically contain the highest concentrations of Na in foods, there is significant scope for manufacturers to gradually reduce the Na content of these products and significantly reduce Na intakes on weekends and holidays. Soya sauce is one such product which, although only small amounts may be used in one day, on average contributes 3 % of salt intake.
The comparability of these results, using two different methodologies, confirms within our selected sample population group that those reporting weekend dietary intake and performing 24 h urine collections at the weekend had a greater intake, resulting in 0·9 g salt/d higher dietary intake and 0·8 g salt/d from 24 h urinary excretion. These results are similar to data from the US National Health and Nutrition Examination Survey (NHANES) where on average adults consumed 0·5 g more salt on a Saturday compared with a weekday( Reference An 13 ). Generally people appear to consume less healthy foods at weekends( Reference Haines, Hama and Guilkey 25 ) and may be more likely to consume more discretionary foods. In NHANES, there was an increase in energy from discretionary foods at weekend days which contributed to greater intakes of total fat, saturated fat, sugar and Na( Reference An 13 ). We found some indication that on weekend days, more Na came from processed meats in contrast to Na coming from fresh meat consumption, which tended to fall.
Although we did not collect information on which foods were eaten outside the home, there is evidence from the USA that eating fast foods and eating in full-service restaurants are more prevalent at weekends( Reference An 13 ). In addition, it has been found that eating at both fast-food and full-service restaurants is associated with increased intakes of total energy, total fat, saturated fat, cholesterol and Na (0·75 and 1·0 g salt/d, respectively)( Reference An 26 ). In US high-school children, a 10-year longitudinal study found that frequency of fast-food intake predicted Na intake, such that those consuming fast foods at least four times weekly had a 5 % higher daily intake of Na compared with those consuming none( Reference Schmidt, Affenito and Striegel-Moore 27 ). The average amount of Na contained in fast-food products from large food outlet chains in Australia has been reported to be 605 mg Na (1·5 g salt) per serving( Reference Garcia, Dunford and Sundstrom 8 ) and there is huge scope to reduce the Na content of many of these high-Na foods, which people are more likely to consume on a regular basis at weekends. Salt does serve some technological functions in food, such as dough development in bread and water binding and preservation in meats; however, for many food products, the amount of salt added generally exceeds that needed to enhance taste( Reference Hutton 28 ).
The strength of the current study is that we collected both an objective measure of Na intake (24 h urine excretion) together with information on dietary intake over a 24 h period using robust standard methodology. Although the study included two different groups of people who collected their urine and reported their dietary intake on different days of the week (30 and 21 %, respectively, performed their 24 h urine collection and reported their dietary intake at weekends), we did find that both urinary salt excretion and dietary intake were higher at weekends in this group with an average age of 57 years.
Conclusions
Salt intake in in this population, assessed from 24 h urine collections, was between 35 and 62 % above recommended levels of 5–6 g/d. Both urine excretion of salt and dietary information confirmed that salt intake was 8 and 14 %, respectively, higher on weekend days, which raises the long-term average of an individual’s daily consumption of salt. It is also likely that the dietary habits and food choices at weekends, which contribute to a greater consumption of salt on weekend days, will be similar to those seen for holiday periods, leading to long-term higher intakes which over a lifetime are likely to increase cardiovascular risk. The main food groups that contributed more Na on weekends were processed meats and mixed dishes containing cereals (e.g. pasta, rice and pizza dishes). Substantial reductions in Na content of both staple foods and ‘occasional’ foods (convenience and takeaway foods which have high levels of Na) are required to achieve significant sustained reductions in population salt intake. This is particularly the case as eating out, takeaway and convenience foods appear to be becoming more of the ‘usual’ way of life in Australia, as well as other developed countries.
Acknowledgements
Acknowledgements: The authors would like to acknowledge the contributions of the Victorian Department of Health and Human Services for provision of the VHM data and Baker IDI for collecting the initial VHM data. Financial support: The data collection and laboratory analyses were funded by an Australian Government National Health and Medical Research Council (NHMRC) partnership grant. Other partners included AWASH (Australian Division for World Action on Salt and Health), NSW Health, NSW Food Authority and the Australian Food and Grocery Council. J.W. is supported by a joint NHMRC Career Development Fellowship/Heart Foundation Future Leaders Fellowship (grant number 1082924) and undertakes additional work on salt reduction from the NHMRC, the WHO and VicHealth. C.G. is supported by an Alfred Deakin University postdoctoral fellowship. J.E.S. is supported by an NHMRC Research Fellowship. The funders had no role in the design, analysis or writing of this article. Conflict of interest: C.N. and C.G. are members of the World Action on Salt and Health (WASH) and AWASH Australian Action on Salt and Health; neither receives any financial support from these. C.N. has received remuneration from Meat and Livestock Australia, Nestlé Health Science and the Dairy Health Consortium as a consultant. These payments are unrelated to the submitted work. J.C. has received grants from the NHMRC of Australia as Chief Investigator for studies on dietary salt content and dietary salt reduction. J.W. is Director of the WHO Collaborating Centre on Population Salt Reduction. V.F. has received grants from Meat and Livestock Australia, Dairy Australia and the Grain and Legume Nutrition Council, for unrelated research work. Authorship: C.N. wrote the manuscript and oversaw the data analysis. V.F., M.W., M.-A.L., J.C., J.E.S. and J.W. contributed to the design and monitoring of the study. K.L. performed the data analysis and C.G. devised the data analysis approach together with C.N. C.G. took responsibility for the integrity of the data and the accuracy of the data analysis. All authors provided input into the final manuscript. Ethics of human subject participation: This study was conducted according to the guidelines laid down in the Declaration of Helsinki and all procedures involving human participants were approved by the ethics committees of the Alfred Hospital (Project No. 421/10) and Deakin University (Project No. 2011-025). Written informed consent was obtained from all participants.


