


It has now been four years since the implementation of the Mexican sugar-sweetened beverage (SSB) tax at the beginning of 2014 – the first substantial, nationwide tax on SSB for health-related reasons. The enactment of this SSB tax, its robust evaluation and positive effects on reducing SSB purchases set a path for increasing global action in the years to follow. The implementation of SSB taxes as part of wider efforts to address obesity and diet-related chronic diseases was recognized to be at a tipping point in 2016( Reference Backholer, Blake and Vandevijvere 1 ). Unlike other recommended obesity prevention policies, such as restrictions on unhealthy food marketing to children, SSB taxes are fast becoming a norm in the USA and elsewhere around the globe, and the scientific evidence base is increasing and strengthening. Contradicting the view that SSB taxes are a progressive or left-wing preference, a recent study found that most SSB taxes are implemented by conservative or right-wing governments( Reference Hagenaars, Jeurissen and Klazinga 2 ). A recent review( Reference Wright, Smith and Hellowell 3 ) on key policy lessons from health taxes does, however, highlight the importance of being clear about the primary goal of the tax as health taxes remain vulnerable to hostile lobbying. Earmarking health taxes for health spending was clearly found to increase both public and political support for their implementation.
Here we provide an updated timeline of action (below and Fig. 1) and highlight evidence and lessons for the year that was 2017.
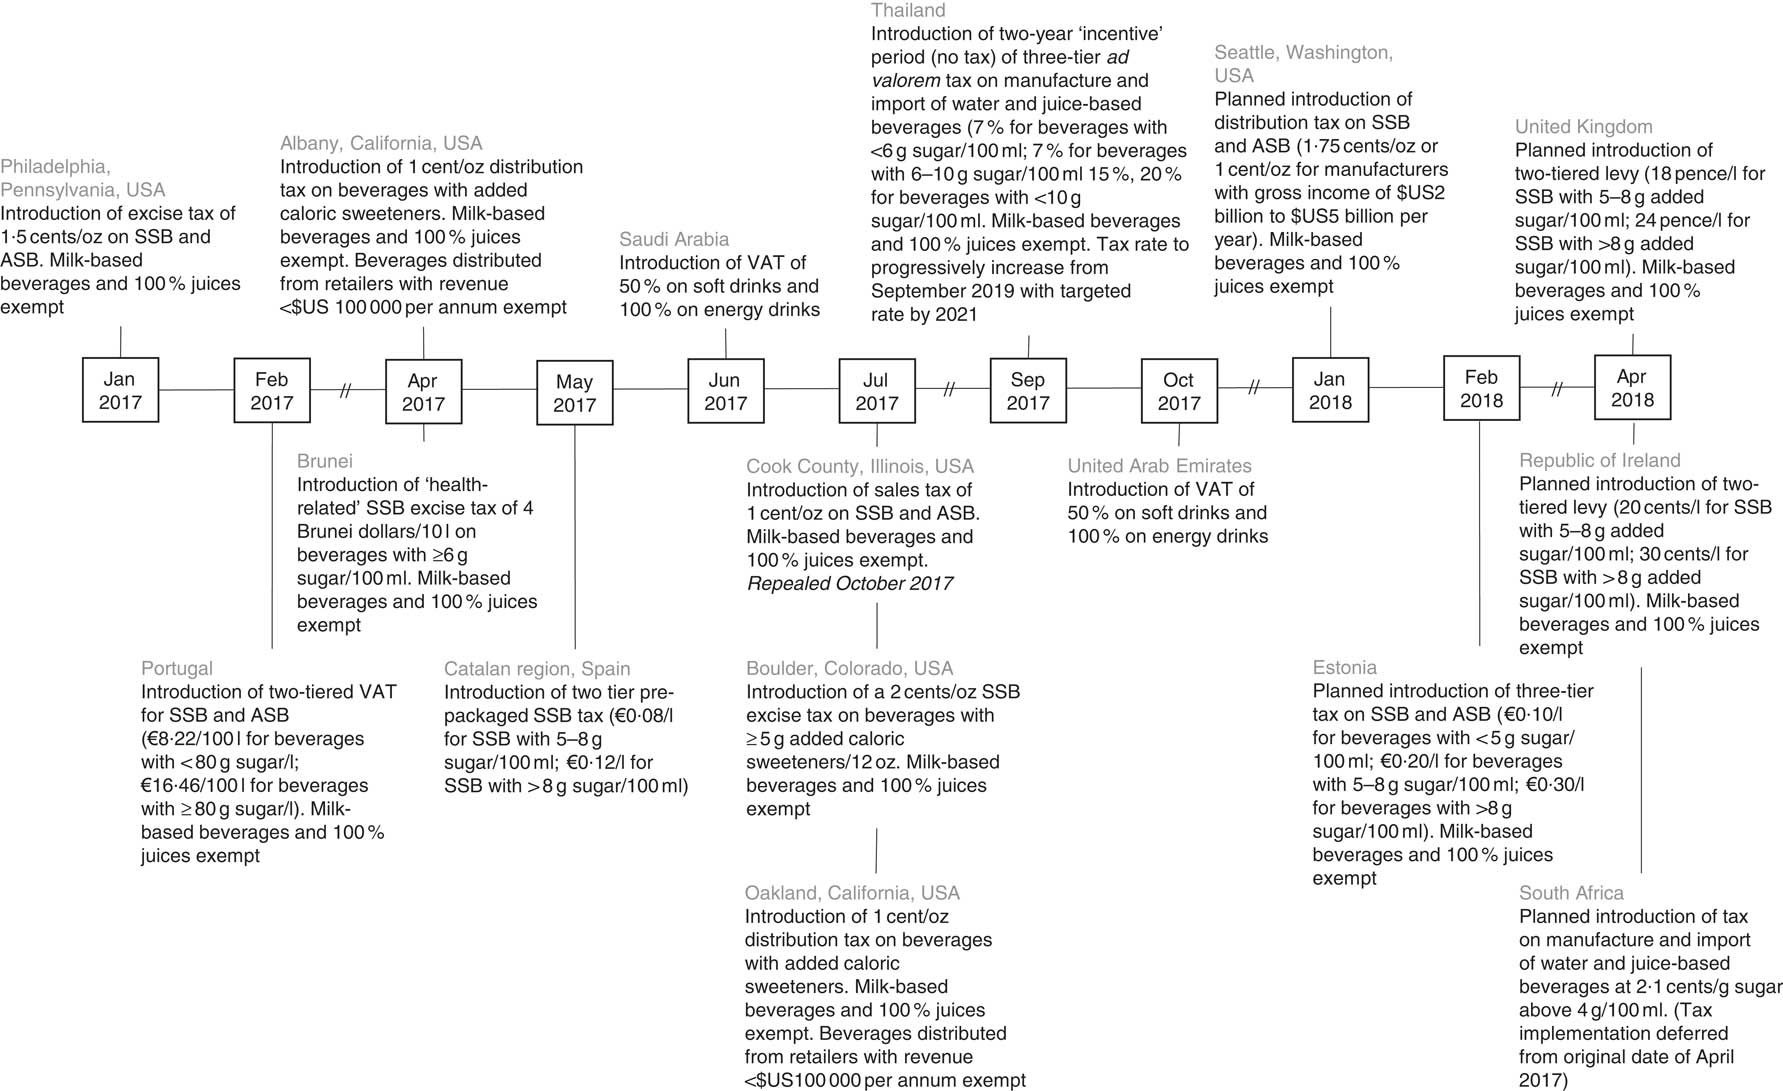
Fig. 1 Timeline of notable international progress of sugar-sweetened beverage (SSB) taxation, 2017–18 (VAT, Value Added Tax; ASB, artificially sweetened beverage)
Notable action
Much of the SSB tax action in 2017 was concentrated in the USA, with the implementation of SSB taxes in six cities following city council or public vote (all approved in 2016 with the exception of Seattle, Washington, which was approved in June 2017). In the Middle East the highest SSB taxes to date were implemented in Saudi Arabia and United Arab Emirates. Other countries and jurisdictions that joined the SSB tax crusade included Portugal, Brunei and the Catalonian region of Spain. This year also saw Estonia and Thailand pass legislation on SSB taxes, with taxation due to be mandated in the coming years. Meanwhile, the UK and Ireland are preparing for a 2018 implementation of a two-tiered levy on the sugar content in SSB. Below we summarize each of these actions. For specific design elements of each tax (magnitude, type of tax and targeted products), see Fig. 1.
Actions in the USA
After defeating a relentless $US 9 million campaign by the American Beverage Association opposing the SSB tax proposal in 2016( 4 ), Philadelphia adopted the SSB tax legislation in January 2017. The tax was introduced with the explicit goal of financing universal pre-kindergarten, for which broad support existed, and deliberately not framed as a health intervention, to avoid contentious debates about the role of government in changing individual behaviour( Reference Purtle, Langellier and Le-Scherban 5 ). The Mayor of Philadelphia announced that as of June 2017, the tax had funded 2000 pre-school childhood education placements and provided 4500 neighbourhood public-school students and their families with community school supports at nine different schools( 6 ).
April saw the implementation of an SSB tax in Albany, California( 7 ). Drinks distributed to small retailers (<$US 100 000 in annual gross receipts) are excluded. Revenue will go into a general city fund, with an informal advisory committee to make recommendations as to how money should be spent. Cook County, Illinois followed in July when the Cook County Sweetened Beverage Tax Ordinance( 8 ) came into effect, with the primary purpose to raise revenue to alleviate budget deficit. The tax was repealed three months later following a veto vote by the Cook County Board of Commissioners in response to persistent public pressure fuelled by the soda industry, which reportedly channelled millions into media, lobbying and political activity to oppose the tax( Reference Dewey 9 ).
In July, Boulder, Colorado effected its SSB tax( 10 ). Revenue has been earmarked primarily for supporting health, wellness and chronic disease programmes for those identified as most at risk. Revenue will also be used to cover the administrative costs of the tax( 10 ). Also in July, the city of Oakland, California implemented an SSB tax( 11 ). Small business distributors (<$US 100 000 in annual gross revenue) are excluded from the tax. Revenue has been allocated to general funds with a nine-member Community Advisory Board providing recommendations to the city council as to how money could be spent on programmes that prevent or reduce the health consequences associated with regular SSB consumption. The city of Seattle, Washington passed a council vote 7–1 in favour of a Sweetened Beverage Tax in June, to take effect in January 2018( 12 ). The tax is reduced (from 1.75 cents to 1 cent per fluid ounce) for manufacturers with an international gross income of more than $US 2 billion but less than $US 5 billion. It has been suggested that 20 % of the revenue raised from the tax will be directed to one-off city expenditures for 5 years, with the remaining revenue to be allocated to a range of public health services, including support for public health and healthy food initiatives, programmes to address inequalities in health, and general administration costs relating to the tax.
While the US city taxes outlined above were successfully adopted by public or council vote (albeit later repealed in Cook County), a citizen vote for an SSB tax in Santa Fe, New Mexico (with revenue proposed to be earmarked for early childhood programmes) failed, with 42 % in support of the tax. While it is unclear why the SSB tax bill in Santa Fe failed, it has been speculated that the lack of early and thoughtful engagement with the public, both in terms of the health risks associated with regular SSB consumption and how the revenue from that tax may be reinvested, may have influenced the outcome( 13 ).
Actions in other countries
At the national level, in February, Portugal implemented a two-tier Value Added Tax to beverages with added sugar and other sweeteners( 14 ). There is an indication that the tax design will be modified in the next budget, but exactly why this is the case or what modifications will occur is currently unclear.
In April, in an attempt to align the nation ‘towards a healthier society’, Brunei introduced a health-related SSB tax as part of a broader tax strategy for the nation( 15 ). This SSB tax came into effect in April 2017. There has been no indication as to how revenue will be used.
Approximately a month later, in May, the Catalan regional government in Spain implemented a two-tier tax on pre-packaged SSB, enacted throughout the whole of Catalonia, regardless of manufacturer origin( 16 ). Importantly, the bill stipulates that the taxpayer (i.e. the manufacturer) is required to pass the tax on to the end consumer. However, it is unclear what mechanisms are in place to enforce this. In June the Spanish trade associations and companies united in a request to the Spanish Government to reverse the tax through an appeal to the constitutional court (which, to date, has not resulted to any legislative changes).
June saw Saudi Arabia implement the largest national SSB tax to date (after approval in January 2017) as part of a much broader Value Added Tax Framework Agreement to raise general government revenue as income from natural resources declines( 17 ). Unusual for a country of very few consumption taxes and no income tax, this policy represented the largest tax to date (50 % tax on soft drinks and 100 % tax on energy drinks). The United Arab Emirates followed suit in October 2017( Reference Burki 18 ).
This year Thailand became the first South-East Asian country to announce a three-tiered excise tax on SSB. The policy came into action in September, beginning with a two-year ‘incentive’ period, where tax rates have not, and will not, change, but manufacturers are encouraged to reformulate to lower-sugar products. As of September 2019, it is expected that the tax rate will increase progressively to achieve the targeted tax rate by 2021.
Meanwhile the UK and Ireland prepare for an April 2018 SSB tax implementation. Ireland released details of its SSB tax this year, of which the design (in terms of both magnitude and date of implementation) closely aligns with that of the UK to retain price parity and reduce cross-border trade between the Republic of Ireland and Northern Ireland. The intention of targeting sugar in these SSB taxes, rather than the beverage itself, is to promote product reformulation to lower-sugar beverages. Indeed, in March this year, the UK Office for Budget Responsibility released revised SSB tax revenue predictions, substantially reducing the expected revenue (a reduction of more than £150 million ($US 196 million) in 2021–22), reporting that beverage manufacturers have responded to the imminent policy with more aggressive reformulation than initially expected( 19 ). The report also announced that the original exclusion of small producers and importers from the SSB tax would be retracted for importers of major brands, regardless of the volume imported (which is expected to increase revenue by approximately by £45 million ($US 59 million) in 2021–22).
Real-world evidence
Key evidence from real-world SSB taxes released this year were those relating to the one-year results from Berkeley, California and the two-year results from Mexico. While these studies are both somewhat limited in causal inference due to their observational nature, the similar evaluation conclusions from two quite different contexts largely strengthen the body of evidence of real-world effectiveness. Preliminary evaluation of beverage price changes following the implementation of an SSB tax in Barbados was also released this year.
Evidence from Mexico
The two-year evaluation of a peso per litre SSB tax in Mexico was published in March 2017( Reference Colchero, Rivera-Dommarco and Popkin 20 ). Store purchase data for 6645 households from January 2012 to December 2015 revealed a sustained reduction in the purchase of taxed beverages two years post policy implementation. While the reduction in SSB purchases increased over time in the first 12 months post policy implementation, this reduction stabilized in the second 12 months at an average of 9·7 % reduction compared with predicted purchases in 2015 (average 5·5 % reduction in 2014). Similar to the 12-month results, the decline in SSB purchases was greatest for the lowest-income households (average 9·0 % reduction in 2014 and 14·3 % in 2015 compared with high-income households, where there was a 4·4 % reduction in 2014 and a 5·6 % reduction in 2015) and was driven predominantly by a reduction in non-carbonated beverage purchases. The increased purchase of untaxed beverages was also sustained over the two-year post-tax period (2·1 % increase). Another study by the same lead author this year examined variation in the 12-month post-SSB tax results in Mexico according to urban or rural location and household composition. This analysis revealed that tax pass-through and the reduction in SSB purchases were lesser in rural areas of Mexico compared with urban areas( Reference Colchero, Molina and Guerrero-Lopez 21 ). Moreover, in September, contrary to industry rhetoric, the publication of an analysis three years post SSB tax policy implementation in Mexico demonstrated no change in employment in the non-alcoholic beverage and non-essential energy-dense food manufacturing industries( Reference Guerrero-López, Molina and Colchero 22 ).
2017 also saw the release of industry-funded research evaluating the impact of the Mexican SSB tax on SSB sales( Reference Arteaga, Flores and Luna 23 ). This research from the Autonomous University of Nuevo Leon (UANL), which used monthly industry time-series data of soft drink purchases between January 2007 and March 2017, concluded that the tax was associated with a reduced per capita consumption of soft drinks of 3·8 %. Variations across higher- and lower-income households were not reported. Contrary to the beverages industry’s propositions, these results are not in contrast with those of Colchero et al.( Reference Colchero, Rivera-Dommarco and Popkin 20 ), who also estimated a small impact of the tax on carbonated beverages; as per the evidence described above, reductions in SSB purchases were driven primarily by a reduction in non-carbonated SSB.
Euromonitor International also released an analysis of aggregate SSB sales data for Mexico this year( 24 ), reporting a near full recovery in national soft drink sales in 2016 (0·2 % growth in soft drink sales in 2016) since the implementation of the SSB tax in 2014. This is in direct contrast to the findings reported by Colchero et al.( Reference Colchero, Rivera-Dommarco and Popkin 20 ) and may be explained by two key differences. First, similar to the Mexican SSB tax evaluation by the UANL, this report focuses narrowly on ‘soft drinks’ only, and does not account for non-carbonated SSB. Second, Euromonitor data represent national aggregate sales and therefore do not take account of population growth in Mexico, which has been increasing by 1·2 % per year. In other words, even if the per capita consumption of soft drinks remained unchanged over the time period, total national soft drinks sales would increase( Reference Cherukupalli 25 ).
Interestingly, 2017 also revealed a leak of an internal email exchange between Coca-Cola executives( Reference Pfister 26 ), highlighting findings from industry-funded research. In an email, Kerry Tressler, Director for Public Affairs for Coca-Cola, states: ‘Multiple studies from well-respected institutions in Mexico (ITAM [Mexico Autonomous Institute of Technology], ColMex [The College of Mexico], and UANL, supported by funding from industry) make clear the tax was ineffective’. These leaked emails revealed that the evidence suggesting a return of SSB sales to pre-tax trends, two years post policy implementation, was also funded by industry. Similar comments were made relating to a study demonstrating an increase in business closures following SSB tax implementation, which was done by ‘a key member of the coalition’.
Evidence from Berkeley, California
The 12-month analysis of the Berkeley, California, penny-per-ounce SSB excise tax was published in April 2017. An analysis of twenty-six different stores revealed complete tax pass-through from retailers to consumers in large and small chain supermarkets and gas stations, partial-pass through in pharmacies and negative pass-through in independent corner stores and independent gas stations( Reference Afshin and Forouzanfar 27 ). An analysis of beverage prices from point-of-sale scanner data on 15·5 million supermarket checkouts (from two large chains) found an average tax pass-through of 67 % across all SSB (0.67 cents per ounce), with complete pass-through for carbonated beverages and energy drinks. Using this same source of data, sales of SSB (in ounces) were estimated to decline by 9·6 % compared with projected trends of SSB sales if the tax were not implemented. Conversely, sales of SSB in non-Berkeley stores located in comparison cities rose by 6·9 %. Sales of untaxed beverages rose by 3·5 % in Berkeley compared projected trends compared with 0·5 % for non-Berkeley stores. Importantly, consumer spending per transaction did not change significantly and store revenue tracked as expected if the policy were not in place, representing minimal financial impact to consumers and retailers. In addition to the analysis of objective sales data, that study also collected self-reported beverage intake data from a relatively modest number (and response rate) of adult Berkeley residents (n 957; response rate 17·4 %). In the analysis, reductions in mean daily SSB intake in grams (–19·8 %) and in mean per capita SSB energy intake (–13·3 %) were not statistically significant.
Evidence from Barbados
Finally, a descriptive analysis of the initial beverage price changes following implementation of a 10 % ad valorem SSB tax in September 2015 in Barbados, revealed an average 5·9 % increase in SSB prices and a relatively stable non-SSB price in the two quarters after the tax was implemented( Reference Alvarado, Kostova and Suhrcke 28 ). An ongoing evaluation of the Barbados tax is planned to assess longer-term changes in both beverage prices and sales.
Looking forward
Next year is shaping up to be another big year for SSB tax implementation. San Francisco’s 1 cent-per-ounce SSB tax is set to take effect in January. Estonia is due to follow in January, and the UK and Ireland in April. After a deferred implementation date of April 2017 for the South African SSB tax (following stakeholder submissions to the proposed bill which government is now reviewing), it is also expected that this tax will be implemented next year in April. Whether this comes with amendments to the bill is unclear. In the Philippines the president has called for tax on SSB using locally produced sugar with revenue to be earmarked for feeding programmes that address undernutrition; however, this is yet to pass through government.
In general, confidence of policy makers in implementing SSB taxes seems to be increasing as some countries start implementing much higher levies and other countries begin to contemplate taxing junk food more broadly, such as Chile( Reference Delga 29 ). Evidence for these broader based taxes is also mounting, with the release of the two-year evaluation of the 8 % tax on non-essential energy-dense foods in Mexico this year( Reference Taillie, Rivera and Popkin 30 ). Using longitudinal data on Mexican household purchases between 2012 and 2015, that study demonstrated a 7·4 % decline in the purchase of taxed items, two years post policy implementation (up from 4·8 % one year post policy implementation). Importantly, this effect was greatest among households considered to have a greater preference for taxed food products (12·3 % decline in non-essential energy-dense foods two years post policy implementation).
Industry will continue to act as a formidable opponent to action, so it will be crucial that all polices are embedded in comprehensive and robust evaluation frameworks and the results disseminated widely( Reference Hawkes, Alderman and Chaloupka 31 ). The message that an SSB tax cannot be viewed as a magic bullet to solve the problem of obesity must be actively reiterated and the evidence on the impact of other health outcomes, in particular dental health, strengthened. Long-term impacts of such taxes on population rates of obesity are likely to be small, but should not take away the importance of such policies in the pursuit of healthier population diets reducing diet-related ill health. 2017 proved to be a significant year for international SSB tax action. We expect 2018 to be equally momentous.
Acknowledgements
Financial support: This editorial received no specific grant from any funding agency in the public, commercial or not-for-profit sectors. Conflict of interest: The authors declare no conflicts of interest. Authorship: All authors contributed equally to this editorial. Ethics of human subject participation: Not applicable.

