


The intense market volatility and reduced availability of traditional protein and lipid sources such as fishmeal and fish oil for use in aquafeed have led to constantly evolving dietary formulations( Reference Bendiksen, Johnsen and Olsen 1 – Reference Turchini, Ng and Tocher 3 ). The aquaculture industry has been active in adopting plant and animal protein and lipid sources for the incorporation into aquafeed; however, most of these ingredients contain none or considerably lower levels of the health beneficial fatty acids, namely, n-3 long-chain (C≥20) PUFA (n-3 LC PUFA)( Reference Tocher 2 , Reference Sprague, Dick and Tocher 4 , Reference Turchini, Torstensen and Ng 5 ). Consequently, maximising the deposition efficiency of increasingly limited dietary n-3 LC PUFA into the final edible product will prove integral to ensure the ongoing viability of the aquaculture sector( Reference Emery, Smullen and Keast 6 – Reference Torstensen, Frøyland and Lie 9 ). The possible solutions available to address this challenge are based on the knowledge that changes to the fatty acid composition of the aquafeed influence not only the final fatty acid composition of fish fillets but also the various aspects of fatty acid metabolism, including in vivo fatty acid β-oxidation and bioconversion( Reference Hixson, Parrish and Xue 10 – Reference Torstensen, Lie and Frøyland 13 ). Concomitant with an increased understanding of fatty acid metabolism within popular cultured species in recent years, dietary formulations have been manipulated to promote the sparing of n-3 LC PUFA from catabolism as well as stimulate endogenous production via the n-3 LC PUFA biosynthetic pathway( Reference Francis and Turchini 7 , Reference Torstensen, Frøyland and Lie 9 , Reference Hixson, Parrish and Xue 10 , Reference Karalazos, Bendiksen and Dick 14 ). The n-3 LC PUFA biosynthetic pathway is facilitated by desaturase and elongase enzymes found in many fish and mammalian species( Reference Tocher 12 , Reference Monroig, Zheng and Morais 15 , Reference Nakamura and Nara 16 ). However, the activity and efficiency of these enzymes in converting shorter (C18), less unsaturated fatty acids into longer (C20-22), more unsaturated fatty acids are not uniform across species( Reference Tocher 12 , Reference Castro, Tocher and Monroig 17 ). Specifically, carnivorous marine species of fish are purported to have a severely limited capacity to biosynthesise 22 : 6n-3 from 18 : 3n-3 dietary substrate( Reference Monroig, Webb and Ibarra-Castro 18 – Reference Venegas-Calerón, Sayanova and Napier 20 ). It is hypothesised that the abundance of n-3 LC PUFA in marine ecosystems, which originate in lower trophic microbial and invertebrate organisms( Reference Kabeya, Fonseca and Ferrier 21 ), has rendered the n-3 LC PUFA biosynthetic pathway largely redundant( Reference Tocher 12 , Reference Nakamura and Nara 16 , Reference Monroig, Webb and Ibarra-Castro 18 , Reference Morais, Monroig and Zheng 19 ). Conversely, freshwater and anadromous fish have adapted to a relative paucity of dietary available n-3 LC PUFA and exhibit a much higher capacity to biosynthesise physiologically required n-3 LC PUFA from dietary 18 : 3n-3( Reference Bell, McEvoy and Tocher 22 – Reference Turchini, Hermon and Cleveland 25 ).
Atlantic salmon (Salmo salar) have a demonstrated, albeit often limited, ability to bioconvert 18 : 3n-3 to 22 : 6n-3( Reference Torstensen, Frøyland and Lie 9 , Reference Tocher, Bell and Dick 26 , Reference Tocher, Bell and Dick 27 ). Consequently, numerous metabolic responses to dietary fatty acid changes have been elucidated in this species( Reference Nuez Ortin, Carter and Nichols 8 , Reference Norambuena, Morais and Emery 11 , Reference Torstensen, Lie and Frøyland 13 , Reference Monroig, Zheng and Morais 15 , Reference Bell, McEvoy and Tocher 22 , Reference Ruyter and Thomassen 23 , Reference Giri, Graham and Hamid 28 – Reference Tocher, Fonseca-Madrigal and Bell 30 ). It has been shown that endogenous production of 22 : 6n-3 in Atlantic salmon is heavily influenced by the dietary ratio of shorter-chain to long-chain n-3 PUFA. Specifically, an increase in substrate (18 : 3n-3) availability appears to enhance the activity of the ∆-6 desaturase enzyme necessary for the first and one of the last steps of the n-3 PUFA bioconversion pathway( Reference Hixson, Parrish and Xue 10 , Reference Glencross, Tocher and Matthew 31 – Reference Turchini and Francis 34 ). Conversely, the presence of end product (22 : 6n-3) may elicit a negative feedback mechanism on the pathway( Reference Thomassen, Rein and Berge 33 ). Furthermore, the extent of endogenous synthesis of 22 : 6n-3 in Atlantic salmon may only occur to an extent that satisfies a minimum physiological requirement, which itself, is dictated by changing environmental conditions and life history stage( Reference Torstensen, Frøyland and Lie 9 , Reference Tocher 12 , Reference Mellery, Geay and Tocher 35 ). For instance, n-3 LC PUFA synthesis is generally more efficient in the juvenile stages and then decreases in the seawater growth phase( Reference Glencross 36 ). Therefore, endogenous synthesis has been documented to be unable to enrich the fillet tissue with n-3 LC PUFA to the same extent as dietary added fish oil in Atlantic salmon( Reference Torstensen, Lie and Frøyland 13 , Reference Sissener, Sanden and Torstensen 24 , Reference Kjær, Ruyter and Berge 37 – Reference Xue, Hixson and Hori 41 ). Nevertheless, there remains multiple, interrelated dietary and environmental factors that dictate the final concentration of n-3 LC PUFA that can be synthesised de novo ( Reference Hixson, Parrish and Xue 10 , Reference Giri, Graham and Hamid 28 , Reference Lewis, Hamid and Alhazzaa 42 – Reference Zheng, Torstensen and Tocher 45 ).
Currently, commercial aquafeed formulations for Atlantic salmon contain a physiological excess of n-3 LC PUFA to ensure a high level of deposition of these fatty acids into the fillet tissue. Atlantic salmon, in particular, are popular with consumers, in part, due to historically high levels of n-3 LC PUFA( Reference Tocher 46 – Reference Strobel, Jahreis and Kuhnt 48 ). However, this is becoming increasingly marginal due to mounting pressure from both within and outside the aquaculture industry for n-3 LC PUFA-rich oil sources. Levels of n-3 LC PUFA in farmed Atlantic salmon have followed a declining trend( Reference Sprague, Dick and Tocher 4 ) and are approaching the minimal levels needed to satisfy both, the physiological needs of the animal and consumer expectation. Therefore, novel approaches to maximise the deposition efficiency of nutritionally valuable fatty acids in this popular table fish are increasingly sought after( Reference Tocher 2 , Reference Francis and Turchini 7 , Reference Tacon and Metian 49 ). In the future, a more efficient utilisation of n-3 LC PUFA in cultured salmonids may be reliant on dietary strategies that maximise n-3 PUFA bioconversion( Reference Hixson, Parrish and Xue 10 , Reference Giri, Graham and Hamid 28 , Reference Tocher 46 ). Hence, further research that elucidates the potential to exploit fatty acid metabolism, namely, n-3 LC PUFA, bioconversion in large Atlantic salmon is warranted.
To date, the majority of laboratory-based fish trials have focused on smaller sub-market-sized fish due to logistical constraints. This limits commercial relevance as physiological fatty acid requirements, and by extension in vivo fatty acid metabolism, change in response to ontogenic development( Reference Tocher 46 ). Furthermore, trials conducted on farm may compromise the accuracy of feed and fatty acid uptake measurements due to a typically higher food conversion ratio and difficulties quantifying uneaten feed( Reference Talbot, Corneillie and Korsøen 50 ). Accordingly, the present experiment was conducted in a laboratory set-up with fish grown up to a marketable size. The trial utilised three oil sources, namely, fish oil, poultry by-product oil and camelina oil to create four experimental diets with varying levels of shorter-chain and long-chain n-3 PUFA. The objective, therefore, was to provide altered substrate (18 : 3n-3) and end product (20 : 5n-3 and 22 : 6n-3) ratios along the n-3 LC PUFA bioconversion pathway and subsequently quantify the extent of n-3 LC PUFA biosynthesis, towards enhancing current knowledge, and industry relevance, regarding the potential for endogenous production of n-3 LC PUFA in market-sized Atlantic salmon.
Methods
Ethics statement
All animals and procedures in this experiment were approved by the Deakin University Animal Welfare Committee (B25-2015). All possible steps to minimise animal suffering and provide an enriched environment were taken.
Animals, trial facility and sampling
Juvenile Atlantic salmon (S. salar) were sourced from a commercial producer (Mountain Fresh Trout and Salmon Farm, Harrietville, VIC, Australia) and transported to the Deakin Aquaculture Futures Facility (Deakin University, Warrnambool Campus, VIC, Australia). Juvenile fish were acclimatised to the facility in freshwater before gradually being exposed to saltwater. Smoltification of fish was confirmed by plasma chloride analysis. Following smoltification, fish were acclimatised to the experimental conditions and maintained on a commercial 6 mm salmonid diet (Ridley Aquafeed Pty Ltd) before the commencement of the trial period. The experiment was conducted in a closed-loop, thermostatically controlled, recirculating aquaculture system containing eight (5000 litres) rearing tanks. Physical and biological filtration (drum filter fitted with a 60 µm screen; Hydrotech) and UV disinfection maintained water quality throughout the experiment. The system was maintained on a 12 h light–12 h dark cycle and temperature was kept at 15·0±0·5°C for the duration of the experiment. Dissolved oxygen was maintained at optimal conditions, and the levels of metabolic waste, total ammonia, P, nitrite and nitrate were monitored daily using Aquamerck Test kits (Merck), which remained within acceptable limits throughout the trial. Immediately preceding the trial, an initial sample of six fish were euthanised in excess anaesthetic (AQUI-S, 0·05 ml/l) and stored at –20°C until analysis. Initially, 272 fish were distributed amongst eight tanks (thirty-four fish per tank) and assigned one of four dietary treatments in duplicate (two tanks per treatment; n 2, N 8). After 98 and 196 d, weight checks were performed and fish removed to improve stocking densities. Fish were fed to apparent satiation twice a day at 09.00 and 16.00 h for the entire (283 d) grow-out period. Feed consumption and mortalities (<2 %) were recorded throughout the trial and remained within acceptable limits. Faeces were collected 2 weeks before final sampling for digestibility estimation. At the completion of the grow-out phase, all fish were euthanised in excess anaesthetic (AQUI-S, 0·05 ml/l) and weighed. Subsequently, eighteen fish per treatment (nine fish per tank) were selected and stored at –20°C until analysed. The sampled fish were separated into two groups: the first group (ten fish per treatment; five fish pooled per tank) was used for analysis of biometry and for chemical analysis of whole body, the second group (eight fish per treatment; four fish pooled per tank) was used for biometry and chemical analysis of fillet.
Experimental diets
Four experimental diets were formulated to be iso-lipidic (310 mg/g), iso-proteic (440 mg/g) and iso-energetic (26 kJ/g) (Table 1). For manufacturing the four experimental diets, a 9 mm extruded pellet for Atlantic salmon was produced by a commercial feed producer (Ridley Aquafeed Pty Ltd) and removed from the production process at the feed mill post-extrusion, before oil coating and delivered to Deakin University for subsequent vacuum oil coating of the experimental oils. A small-scale, laboratory-based, vacuum-coater equipped with a vacuum pump and rotation mechanism was used to add the dietary lipid. The four experimental diets were achieved using three different lipid sources, poultry by-product oil, fish oil and camelina oil, to create varied ratios of short-chain and long-chain n-3 fatty acids and therefore four varied compositions of ‘substrate’ (18 : 3n-3) and ‘end product’ (20 : 5n-3 and 22 : 6n-3) in terms of in vivo bioconversion of n-3 fatty acids via the desaturation, elongation enzymatic pathway. The experimental oil blends were added to the ‘uncoated’ pellets and resulted in the following four diets:
∙ Low substrate:Low end product (Low:Low), where added oil consisted of 100 % poultry by-product oil.
∙ Low substrate:High end product (Low:High), where added oil consisted of 80 % poultry by-product oil and 20 % fish oil.
∙ High substrate:Low end product (High:Low), where added oil consisted of 80 % camelina oil and 20 % poultry by-product oil
∙ High substrate:High end product (High:High), where added oil consisted of 80 % camelina oil and 20 % fish oil.
Table 1 Proximate composition, total fatty acids (FA) and FA (mg/g diet) composition of the four experimental diets
NFE, N-free extract; LC, long chain.
* Diets: Low:Low=low substrate, low end product diet consisting of 43 % protein and 32 % lipid, added oil consists of 100 % poultry by-product oil; Low:High=low substrate, high end product diet consisting of 43 % protein and 33 % lipid, added oil consists of 80 % poultry by-product oil and 20 % fish oil; High:Low = high substrate, low end product diet consisting of 44 % protein and 31 % lipid, added oil consists of 80 % camelina oil and 20 % poultry by-product oil; High:High = high substrate, high end product diet consisting of 45 % protein and 32 % lipid, added oil consists of 80 % camelina oil and 20 % fish oil.
† Total FA = total FA mg/g of diet.
‡ Other SFA = sum of 12 : 0, 15 : 0, 17 : 0, 20 : 0, 22 : 0 and 24 : 0.
§ Other MUFA = sum of 14 : 1n-5, 15 : 1n-5, 17 : 1n-7, 20 : 1n-13, 20 : 1n-11, 22 : 1n-11, 22 : 1n-9 and 24 : 1n-9.
|| Total trans-FA = sum of 18 : 1n-9t, 18 : 1n-7t and 18 : 2n-6t.
¶ Other n-6 PUFA = sum of 18 : 3n-6, 20 : 2n-6, 20 : 3n-6, 22 : 2n-6, 22 : 4n-6 and 22 : 5n-6.
** Other n-3 PUFA = sum of 20 : 3n-3, 20 : 4n-3, 24 : 5n-3 and 24 : 6n-3.
†† n-6:n-3 ratio = ratio between n-6 PUFA and n-3 PUFA.
Growth performance, chemical analyses and fatty acid analysis
Standard formulae were used to assess growth, feed utilisation and biometrical data. These included initial and final average weight, weight gain (g), weight gain %, feed conversion ratio (FCR), specific growth rate (SGR), Fulton’s condition factor (K), dress-out percentage, fillet yield percentage (FY%), hepatosomatic index (HSI%) and viscera-somatic index (VSI %). Calculations for these common formulae are presented in detail in Francis et al. ( Reference Francis, Thanuthong and Senadheera 51 ). The chemical composition of the experimental diets, faeces and fish samples was determined via proximate composition analysis according to standard methods, as previously described by Emery et al. ( Reference Emery, Hermon and Hamid 52 ). Briefly, moisture was determined by drying samples in an oven at 80°C to a constant weight, while ash was determined by incinerating samples in a muffle furnace (S.E.M. (S.A.) Pty Ltd) at 550°C for 18 h. Protein (Kjeldahl N: N×6·25) content was determined using an automated Kjeltech 2300 (Foss Tecator) and lipid was determined by solvent extraction( Reference Folch, Lees and Sloane-Stanley 53 ), where dichloromethane was used to replace chloroform for safety considerations. Following lipid extraction, fatty acids were esterified into methyl esters using an acid-catalysed methylation method and then analysed by GC as described in Norambuena et al.( Reference Norambuena, Lewis and Hamid 54 ). Resulting peaks were identified relative to known external standards and then corrected for theoretical flame ionisation detector response and methyl transformation required for GC analysis. The resulting quantitative fatty acid data were eventually reported as mg/g for the experimental diets and as µmol/g tissue (wet weight) for fillet tissue, as recommended by Parrish( Reference Parrish 55 ).
Apparent nutrient digestibility and metabolism calculations
Apparent digestibility was determined following methods presented in Atkinson et al.( Reference Atkinson, Hilton and Slinger 56 ), using ash instead of acid-insoluble ash as the inert marker. The calculation of apparent in vivo fatty acid metabolism was performed using the whole-body fatty acid balance method, as initially proposed and described by Turchini et al. ( Reference Turchini, Francis and De Silva 57 ) with further development( Reference Turchini and Francis 34 , Reference Turchini, Francis and De Silva 58 ). The results of the whole-body fatty acid balance method are reported as nmol/g per d and percentage of net intake as presented in Norambuena et al.( Reference Norambuena, Morais and Emery 11 ).
Statistical analysis
All data were reported as means with their standard errors (n 2, N 8). After confirmation of normality and homogeneity of variance, data were subjected to two-way ANOVA to assess the effects of dietary substrate, dietary end product and dietary substrate by end product interactions. A Tukey’s post hoc test determined statistical significance between homogenous subsets and was performed where statistical significant differences were identified. The analysis was performed using IBM SPSS Statistics version 24.0 (SPSS Inc.). Significance was accepted at P<0·05, where * P<0·05; ** P<0·01 and *** P<0·001.
Before the experiment, based on recent research with a similar study design and similar sized fish( Reference Rosenlund, Torstensen and Stubhaug 59 ), a between-group, within-treatment standard deviation of 197·4 was expected for an outcome of importance, specifically, final fish weight. Power analysis revealed that the minimum detectable difference in final weight between treatment groups given the sample size in the present study and assuming a statistical power of 80 % was 262 g. This was considered acceptable for the present study, considering the expectedly large final weights of the fish. Power analysis was performed using GraphPad StatMate version 2.0 (Graphpad Software Inc.).
Results
Diets
The four experimental diets were iso-energetic and proximate compositions were similar (Table 1). Total fatty acid concentration ranged from 247·4 to 272·6 mg/g diet in High:Low and Low:Low, respectively. Levels of individual fatty acids varied according to lipid source. Accordingly, Low:Low and Low:High were characterised by higher levels of both SFA and MUFA due to typically high 18 : 1n-9 concentrations in poultry by-product oil. Total PUFA levels were higher in High:Low and High:High; however, n-6 PUFA was relatively consistent between dietary treatments. Levels of n-3 PUFA were markedly higher in High:Low and High:High, owing to high levels of 18 : 3n-3. Diet n-3 LC PUFA levels were predictably dictated by fish oil inclusion and were higher in Low:High and High:High owing to higher 22 : 6n-3 concentrations. The ratio of n-6:n-3 fatty acids varied considerably between treatments, ranging from 0·8 to 4·1 in High:High and Low:Low, respectively (P<0·05).
Growth, feed utilisation parameters and biometric data
Mortality rates were low during the trial and unrelated to diet. Diets were generally well accepted by fish. However, some maturation of fish occurred in the latter stages of the trial, which led to poorer than expected growth and food conversion. Fish gained approximately 2000 g and grew to weights in excess of 3000 g, with no statistical differences evident between treatments. FCR ranged from 1·14 to 1·26 in Low:Low and High:High, respectively (Table 2) (P>0·05). Overall, there were no significant differences in either growth or biometry measures between dietary treatments, including SGR, FCR, feed ration % (relative to body mass), K, FY% HSI% and VSI%. There were no significant effects of dietary n-3 substrate, end product or substrate by end product interactions recorded with regard to any growth performance parameters.
Table 2 Growth, feed efficiency and biometry of Atlantic salmon fed the four experimental diets for 283 d* (Mean values with their standard errors, n 2, N 8)
FCR, food conversion ratio; SGR, specific growth rate; DP, dress-out percentage; FY, fillet yield percentage; HSI, hepatosomatic index; VSI, viscera-somatic index.
* Treatment means were analysed by one-way ANOVA with Tukey’s post hoc test of multiple comparisons. Effects of substrate, end product and substrate/end product interaction were analysed by two-way ANOVA.
† See Table 1 for experimental diet abbreviations.
‡ K=condition factor.
Apparent nutrient and fatty acid digestibility
High nutrient digestibility values (apparent digestibility coefficient%) were observed across treatments, with only one significant difference recorded, where N-free extract digestibility was higher in Low:Low in comparison with High:High (P<0·05) (Table 3). Fatty acid digestibility values were high with no significant differences recorded between treatments, though there was a significant effect of end product recorded for the digestibility of 20 : 5n-3.
Table 3 Nutrient and fatty acids (FA) digestibility (apparent digestibility coefficient, %) of the four experimental diets in Atlantic salmon* (Mean values with their standard errors, n 2, N 8)
NFE, N-free extract.
a,b Mean values within a row with unlike superscript letters were significantly different (P<0·05). * Treatment means were analysed by one-way ANOVA with Tukey’s post hoc test of multiple comparisons. Effects of substrate, end product and substrate/end product interaction were analysed by two-way ANOVA.
† See Table 1 for experimental diet abbreviations.
‡ Calculated on the basis of 23·6, 39·5 and 17·2 kJ/g of protein, fat and carbohydrate, respectively.
§ Value of 100=FA not detected in faeces.
Tissue proximate and fillet fatty acid composition
No significant differences in fillet proximate composition were evident (Table 4), even if fillet lipid concentrations varied between treatments, ranging from 75·1 to 104·7 mg/g tissue in Low:High and High:High, respectively (P>0·05). Owing to differences in fillet lipid, total fatty acid concentration was lowest in Low:High and highest in High:High, though differences were not significant (P>0·05). Expectedly, fillet levels of 22 : 6n-3 were higher in High:High compared with Low:Low in terms of both µmol/g of fillet tissue and mg/100 g of fillet (P<0·05). However, High:Low had comparable levels of 22 : 6n-3 compared with both Low:High and High:High (P>0·05). Furthermore, High:Low had marginally higher levels of total n-3 LC PUFA compared with Low:High, despite the latter treatment diet containing no added fish oil (P>0·05). As expected, High:High had higher levels of n-3 LC PUFA compared with Low:Low (P<0·05). The n-6:n-3 PUFA ratios varied across treatments and followed dietary trends, ranging from 1·0 to 2·7 in High:High and Low:Low, respectively (P<0·05). Across treatments, there was a clear effect of substrate and end product recorded for 20 : 5n-3, 22 : 5n-3 and total n-3 LC PUFA in terms of both µmol/g of fillet tissue and mg/100 g of fillet; however, no significant substrate by end product interaction was recorded.
Table 4 Proximate (mg/g of tissue) and fatty acid (FA) composition (µmol/g tissue) of fillets of Atlantic salmon fed the four experimental diets for 283 d* (Mean values with their standard errors, n 2, N 8)
LC, long chain.
a,b,c Mean values within a row with unlike superscript letters were significantly different (P<0·05).* Treatment means were analysed by one-way ANOVA with Tukey’s post hoc test of multiple comparisons. Effects of substrate, end product and substrate/end product interaction were analysed by two-way ANOVA.
† See Table 1 for experimental diet abbreviations.
‡ See Table 2 for FA classes and abbreviations.
§ Other SFA = sum of 12 : 0, 15 : 0, 17 : 0, 20 : 0, 21 : 0, 22 : 0 and 24 : 0.
|| Other MUFA = sum of 14 : 1n-5, 15 : 1n-5, 17 : 1n-7, 20 : 1n-11, 22 : 1n-11 and 24 : 1n-9.
¶ Other n-6 PUFA = sum of 18 : 3n-6, 20 : 3n-6, 22 : 2n-6, 22 : 4n-6, 22 : 5n-6.
†† Other n-3 PUFA = sum of 18 : 4n-3, 20 : 4n-3, 22 : 3n-3, 24 : 5n3 and 24 : 6n-3.
Apparent in vivo fatty acid metabolism
Apparent in vivo fatty acid β-oxidation (expressed as nmol of fatty acid β-oxidised, per gram of fish per d; nmol/g per d and as percentage of net intake) (Table 6 and Fig. 1, respectively) as calculated by the whole-body fatty acid balance method was highest in 16 : 0 and 18 : 1n-9 across all treatments, relative to high dietary inclusion levels. Accordingly, there was a significant effect of substrate and end product concentration on the β-oxidation of SFA (P<0·001 and P<0·01, respectively). MUFA was β-oxidised to a similar extent as SFA where treatments demonstrated a similar trend; however, no significant differences were recorded between treatments (P>0·05). Substrate concentration had a clear effect of the β-oxidation of 18 : 3n-3 (P<0·001), where the High:Low and High:High treatments recorded significantly higher β-oxidation of 18 : 3n-3 (P<0·05). However, in terms of β-oxidation calculated based the percentage of net intake, both the low substrate treatments (Low:Low and Low:High) recorded higher values (approximately 70 %). Notably, 22 : 6n-3 was highly conserved across treatments and recorded low β-oxidation values.
Table 5 Fillet fatty acid composition (as mg/100 g of edible product) of Atlantic salmon fillet fed the four experimental diets for 283 d* (Mean values with their standard errors, n 2, N 8)
LC, long chain.
a,b,c Mean values within a row with unlike superscript letters were significantly different (P<0·05).* Treatment means were analysed by one-way ANOVA with Tukey’s post hoc test of multiple comparisons. Effects of substrate, end product and substrate/end product interaction were analysed by two-way ANOVA.
† See Table 1 for experimental diet abbreviations.
‡ See Table 2 for fatty acid classes and abbreviations.
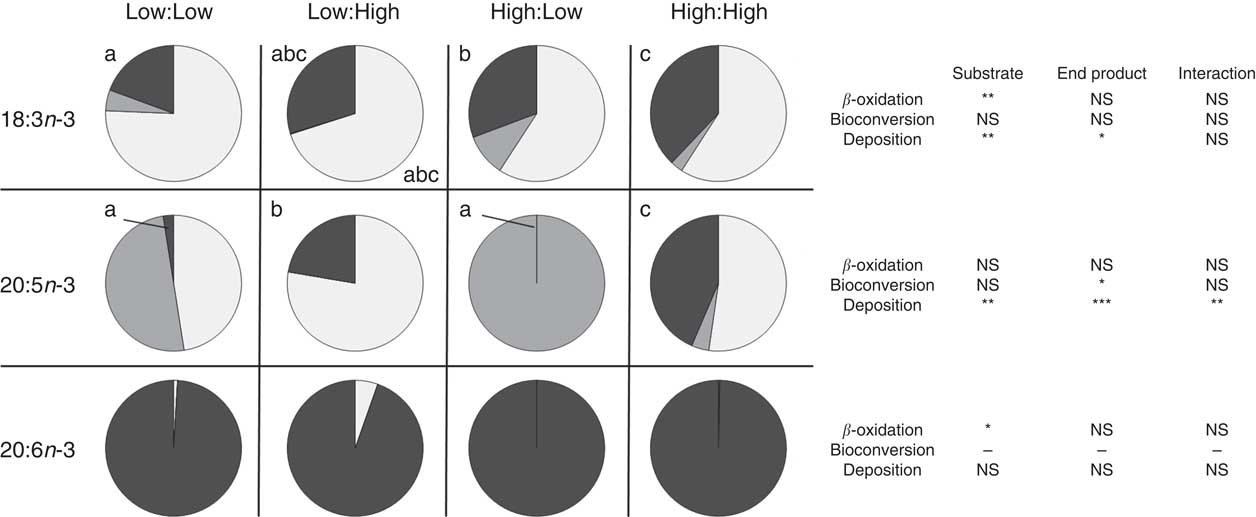
Fig. 1 Metabolic fate of dietary 18 : 3n-3, 20 : 5n-3 and 22 : 6n-3 (β-oxidation, bioconversion and deposition, expressed as percentage of net intake) in post-smolt Atlantic salmon fed experimental diets with altered dietary substrate (18 : 3n-3) and end product (20 : 5n-3 and 22 : 6n-3) ratios for 283 d. a,b,c Values in the same row (either 18 : 3n-3, 20 : 5n-3 or 22 : 6n-3) and for the same category (β-oxidation, bioconversion and deposition) with unlike letters are significantly different (P<0·05) and P values relative to the two-way ANOVA comparing substrate, end product and substrate by end product interactions are reported on the right (* P<0·05, ** P<0·01, *** P<0·001). See Table 1 for experimental dietary abbreviations.
![]() , β-Oxidised (%);
, β-Oxidised (%);
![]() , bioconverted (%);
, bioconverted (%);
![]() , deposited (%).
, deposited (%).
Apparent in vivo fatty acid bioconversion (expressed as nmol of fatty acid bioconverted per gram of fish per d; nmol/g per d and as percentage of net intake) (Table 7 and Fig. 1, respectively) highlighted the elongation of 18 : 0 in three of the four treatments (Low:Low, High:Low and High:High), with the highest values recorded in the High:Low treatment (P<0·05). There was a significant effect of end product concentration on the ∆-6 desaturation of 18 : 2n-6 (P<0·001) with Low:Low recording the highest level of activity (P<0·05). Elongation of 18 : 3n-6 was noted in all treatments; however, this was significantly higher in Low:Low (P<0·05). Likewise, ∆-5 desaturation of 20 : 3n-6 was highest in Low:Low (P<0·05), whilst ∆-5 desaturation of 20 : 4n-3 was highest in High:Low, with negligible activity recorded in the other treatments (P<0·05). The High:Low treatment recorded the highest level of ∆-6 desaturation of 18 : 3n-3 (P<0·05) and numerically, albeit not statistically, higher levels of 24 : 6n-3 desaturation. In addition, there was a significant effect of substrate, end product and a substrate by end product interaction recorded for the ∆-6 desaturation of 18 : 3n-3. The High:Low treatment recorded significantly higher levels of elongation of 20 : 5n-3 (P<0·05) and also higher elongation of 22 : 5n-3, though the results for the latter were not significant. Recorded levels of 24 : 6n-3 chain shortening, the final step of endogenous 22 : 6n-3 production, were highest in High:Low; despite relatively minimal amounts recorded in all other treatments, the differences were not significant (P>0·05).
Table 6 Apparent in vivo fatty acid β-oxidation (nmol/g per d) in Atlantic salmon fed the four experimental diets for 283 d* (Mean values with their standard errors, n 2, N 8)

a,b,c,d Mean values within a row with unlike superscript letters were significantly different (P<0·05).*Treatment means were analysed by one-way ANOVA with Tukey’s post hoc test of multiple comparisons. Effects of substrate, end product and substrate/end product interaction were analysed by two-way ANOVA.
† See Table 1 for experimental diet abbreviations.
‡ β-Oxidation not detected.
§ See Table 2 for fatty acid classes and abbreviations.
|| Fatty acids not recording any β-oxidation are not reported in this table.
Discussion
While previous research has highlighted the capacity for endogenous n-3 LC PUFA production in salmonid species, the extent of this metabolic activity has, up until now, not been well quantified in post-smolt Atlantic salmon. In this respect, the present study demonstrated that the amount of apparent endogenous production of n-3 LC PUFA was variable between treatment groups of fish fed diets containing altered levels of dietary n-3 substrate, namely, 18 : 3n-3, and end products, namely, 20 : 5n-3 and 22 : 6n-3. Despite this it was demonstrated that when provided a diet containing relatively high levels 18 : 3n-3 and low levels of 20 : 5n-3 and 22 : 6n-3, post-smolt Atlantic salmon possesses a capacity for the endogenous synthesis of n-3 LC PUFA via in vivo fatty acid bioconversion. Moreover, when provided with abundant dietary supply of 18 : 3n-3, the extent of endogenous production has the potential to enhance total fillet concentrations of n-3 LC PUFA, complementing, and independent of, dietary n-3 LC PUFA provision. Furthermore, the present study highlights the positive effect of high dietary substrate inclusion (18 : 3n-3), concomitant with the supply of dietary fish oil, on the final concentration of fillet n-3 LC PUFA, attributable to the provision of a suitable substrate for β-oxidation, thus, sparing n-3 LC PUFA from catabolism. These important findings are discussed in further detail herein.
The effect of various lipid sources used in aquafeed on the nutritional value of the fish understandably garners substantial research attention. Nevertheless, growth performance remains a key indicator of the suitability of aquafeed formulations for the use in commercial aquaculture operations( Reference Føre, Alver and Alfredsen 60 ). As reviewed by Glencross( Reference Glencross 36 ) and Turchini et al.( Reference Turchini, Torstensen and Ng 5 ), the substitution of fish oil with terrestrial-based oils has been widely reported to have minimal effect on the growth of salmonids, even at high inclusion levels. Moreover, it has been reported that an excessive inclusion level of LC-PUFA may elicit detrimental effects on fish performance in several species( Reference Betancor, Atalah and Caballero 61 – Reference Ruyter, Rosjo and Einen 64 ). However, currently used levels of dietary n-3 LC PUFA in commercial aquafeed are unlikely to elicit any negative effects on growth performance, given the low levels of marine-sourced oils presently utilised. Recent research advocates dietary n-3 LC PUFA at an inclusion level in excess of 2·7 % of fatty acids is necessary for optimal growth in post-smolt Atlantic salmon( Reference Hixson, Parrish and Xue 10 , Reference Rosenlund, Torstensen and Stubhaug 59 ). With respect to the present study, there was no difference between major growth parameters between any of the treatments, despite no added fish oil in two of the four dietary treatments; hence, it cannot support this minimum recommended requirement for dietary n-3 LC PUFA in terms of growth performance.
Despite apparent contention regarding growth performance, it is widely accepted that the amount of n-3 LC PUFA in the fillet is a reflection of the dietary inclusion level, as reviewed by Bendiksen et al.( Reference Bendiksen, Johnsen and Olsen 1 ), Tocher( Reference Tocher 2 ), Turchini et al.( Reference Turchini, Torstensen and Ng 5 ) and Sales & Glencross( Reference Sales and Glencross 65 ). However, given the demonstrated capacity of Atlantic salmon to endogenously synthesise 22 : 6n-3 from dietary precursors( Reference Rosenlund, Torstensen and Stubhaug 59 , Reference Sanden, Stubhaug and Berntssen 66 ), the mirroring effect between diet and fillet fatty acid compositions may be partially obscured, especially when diets are devoid of added fish oil( Reference Tocher 2 , Reference Miller, Nichols and Carter 67 ). Despite this, the biosynthesis of n-3 LC PUFA from 18 : 3n-3 in salmonids is recognised as a mechanism to satiate the fundamental physiological minimal requirements of n-3 LC PUFA and is generally insufficient to enrich fillets with n-3 LC PUFA to the same extent as dietary added fish oil and in line with consumer expectations( Reference Turchini, Torstensen and Ng 5 , Reference Bell, Henderson and Tocher 68 ). Therefore, the numerically higher fillet levels of n-3 LC PUFA, expressed as both µmol/g and mg/100 g of fillet tissue recorded in fish fed the High:Low diet compared with the Low:High diet, were somewhat unexpected considering the High:Low diet contained no added fish oil. Although it should be noted that similar results were not observed between fish fed the High:Low diet and fish fed the High:High diet. Nevertheless, as it will be discussed, these results highlight differences in lipid metabolism, namely, β-oxidation, bioconversion and deposition of dietary fatty acids, specifically, 18 : 3n-3, 20 : 5n-3 and 22 : 6n-3.
It is well understood that dietary fatty acids provide the vast majority of metabolic energy for salmonids( Reference Tocher 12 ). In particular, MUFA, including 18 : 1n-9, and SFA, including 16 : 0, are known to be readily catabolised for this specific purpose( Reference McKenzie, Higgs and Dosanjh 69 , Reference Sargent, Tocher and Bell 70 ). However, due to the increasing commercial utilisation of dietary oils rich in C18 n-3 PUFA in aquafeed formulations (e.g. canola oil, linseed oil and potentially in the future, camelina oil) 18 : 3n-3 is increasingly relied upon by farmed salmon as a dietary energy substrate( Reference Hixson, Parrish and Xue 10 , Reference Turchini, Nichols and Barrow 40 , Reference Bell, Pratoomyot and Strachan 71 , Reference Hixson, Parrish and Anderson 72 ). Research suggests 18 : 3n-3 is readily catabolised in fish, including salmonids, proportional to dietary inclusion levels( Reference Tocher, Fonseca-Madrigal and Bell 30 , Reference Stubhaug, Lie and Torstensen 73 – Reference Mourente, Dick and Bell 75 ). With respect to the present study, dietary n-3 PUFA substrate level had a significant effect on the β-oxidation of 18 : 3n-3 (P<0·001). Specifically, an increase in dietary 18 : 3n-3 led to a proportional decrease in β-oxidation of 18 : 3n-3 (in terms of percentage of net intake). However, considering the enhanced dietary supply of 18 : 3n-3 in the high-substrate treatments, quantitatively more 18 : 3n-3 was β-oxidised in both high dietary 18 : 3n-3 treatments (in terms of nmol/g per d). Furthermore, the deposition of 18 : 3n-3 proportionally increased with an increased dietary supply. This is in contrast to the notion of decreasing deposition efficiency of n-3 PUFA with increased dietary supply( Reference Francis, Thanuthong and Senadheera 51 , Reference Stubhaug, Lie and Torstensen 73 , Reference Bell, Henderson and Tocher 76 , Reference Budge, Penney and Lall 77 ). However, considering the increased total amount of 18 : 3n-3 in the high dietary 18 : 3n-3 treatments, the actual amount of β-oxidised was greater than the low dietary 18 : 3n-3 treatments.
In addition to providing a suitable substrate for β-oxidation in salmonids, the first step of n-3 PUFA bioconversion has been shown to be primarily modulated by the availability of C18 n-3 PUFA by providing a substrate for ∆-6 desaturase activity( Reference Hixson, Parrish and Xue 10 , Reference Glencross, Tocher and Matthew 31 , Reference Thanuthong, Francis and Manickam 32 , Reference Turchini and Francis 34 , Reference Xue, Hixson and Hori 41 ). The findings of the present study support this, and it was found that the ∆-6 desaturation of 18 : 3n-3 was significantly enhanced by the dietary addition of 18 : 3n-3 (in terms of both nmol/g per d and percentage of net intake). In addition, and in accordance with previous research, the absence of added dietary n-3 LC PUFA appeared to further enhance bioconversion activity relative to the high dietary n-3 LC PUFA treatments owing to the absence of a previously identified negative feedback mechanism acting upon the n-3 LC PUFA bioconversion pathway in both mice and Atlantic salmon( Reference Tocher, Bell and Dick 39 , Reference Raz, Kamin-Belsky and Przedecki 78 ).
Further to 18 : 3n-3 bioconversion, there were observable differences between treatments in relation to the metabolism of 20 : 5n-3. Previous research has suggested n-3 LC PUFA can be preserved from catabolism by careful manipulation of the dietary fatty acid composition termed ‘n-3 LC PUFA sparing’( Reference Turchini, Francis and Senadheera 74 , Reference Codabaccus, Carter and Bridle 79 – Reference Trushenski, Mulligan and Jirsa 82 ). Specifically, the dietary addition of saturated and MUFA has been shown to enhance the retention efficiency of n-3 LC PUFA( Reference Emery, Smullen and Keast 6 , Reference Francis, Thanuthong and Senadheera 51 , Reference Turchini, Francis and Senadheera 74 ). With respect to the present study, diet had a clear effect on the deposition of 20 : 5n-3. The Low:High treatment appeared to favour the catabolism of longer, more unsaturated fatty acids, namely, 20 : 5n-3. In contrast, the High:High treatment had a lesser reliance on n-3 LC PUFA β-oxidation and instead appeared to preferentially β-oxidise 18 : 3n-3. These findings support previous research advocating the suitability of 18 : 3n-3 as a dietary energy substrate( Reference Bell, McEvoy and Tocher 22 , Reference Hixson, Parrish and Anderson 72 , Reference Bell, McGhee and Campbell 83 – Reference Sinclair, Attar-Bashi and Li 85 ). Moreover, they agree with the findings in juvenile salmon advocating the potential for added dietary 18 : 3n-3 to spare n-3 LC PUFA from catabolism( Reference Berge, Ruyter and Asgard 86 ).
Despite a very limited dietary provision of n-3 LC PUFA in the High:Low treatment, virtually all endogenously synthesised 20 : 5n-3 was further bioconverted, culminating in a recorded chain-shortening of 24 : 6n-3 – the final step in n-3 LC PUFA biosynthesis – to produce 22 : 6n-3. In accordance with previous research, it therefore appears that a production of 22 : 6n-3 was favoured over 20 : 5n-3 deposition, which appears to be present predominately as an intermediate step toward the de novo biosynthesis of 22 : 6n-3( Reference Tocher 46 , Reference Stubhaug, Lie and Torstensen 73 , Reference Codabaccus, Bridle and Nichols 87 ). Furthermore, in accordance with previous research that identified a negative feedback mechanism on the n-3 PUFA bioconversion pathway, the presence of dietary n-3 LC PUFA appeared to negatively affect the bioconversion of 20 : 5n-3( Reference Tocher 12 , Reference Thomassen, Rein and Berge 33 , Reference Raz, Kamin-Belsky and Przedecki 78 ).
In general, dietary 22 : 6n-3 is well conserved from catabolism in Atlantic salmon, resulting in similar fillet levels to those provided by the diet( Reference Torstensen, Frøyland and Lie 9 , Reference Mourente, Dick and Bell 75 , Reference Bell, Tocher and Henderson 84 , Reference Bransden, Carter and Nichols 88 , Reference Pratoomyot, Bendiksen and Bell 89 ). The present study largely confirms this and high retention of 22 : 6n-3 was recorded in all treatments. However, a significant effect of dietary substrate level (18 : 3n-3) on the β-oxidation of 22 : 6n-3 was recorded. Specifically, the β-oxidation of 22 : 6n-3 was reduced in both high dietary substrate (18 : 3n-3) treatments. Resultantly, a high dietary 18 : 3n-3 content provided (i) a suitable and highly available β-oxidation substrate that, consequently, enabled the sparing of n-3 LC PUFA from β-oxidation, (ii) an enhanced substrate for bioconversion and (iii) in contrast to high end product treatments, it did not inhibit n-3 LC PUFA biosynthesis which, as mentioned, can elicit a negative feedback mechanism on the n-3 PUFA bioconversion pathway( Reference Tocher 12 , Reference Raz, Kamin-Belsky and Przedecki 78 ). Consequently, the addition of abundant dietary 18 : 3n-3 in diets devoid of added fish oil had a positive effect on the final n-3 LC PUFA level in the fillet of post-smolt Atlantic salmon.
In the absence of added fish oil, the high dietary provision of 18 : 3n-3 potentially provided multiplicative benefits in terms of facilitating the deposition of n-3 LC PUFA in to the fillet tissue by favouring the β-oxidation of dietary C18 n-3 PUFA resulting in an apparent conservation of n-3 LC PUFA from catabolism and by providing sufficient substrate for n-3 LC PUFA biosynthesis. These findings demonstrate the capacity for endogenous n-3 LC PUFA synthesis in post-smolt Atlantic salmon to ameliorate the potential negative consequences on fillet nutritional quality often attributed to a severe reduction or removal of dietary provided fish oil. This provides a commercially relevant platform for the further development of tailored diets with respect to production stage to ensure Atlantic salmon is highly nutritious at the time of harvest. Complementary methods, such as real-time PCR and stable isotope analysis, are suggested in future trials on post-smolt Atlantic salmon. This will enable a better quantification of the possible modulation of known genes associated with n-3 LC PUFA bioconversion processes and a more accurate trace of individual fatty acids along the n-3 LC PUFA bioconversion pathway, and in particular the ability to differentiate from de novo synthesised LC-PUFA v. LC-PUFA spared from catabolic processes. Nevertheless, the information provided herein, scant for post-smolt Atlantic salmon, is essential to create dietary strategies that mitigate a ‘low fish oil future’.
Table 7 Apparent in vivo fatty acid bioconversion (nmol/g per d) in Atlantic salmon fed the four experimental diets for 283 d* (Mean values with their standard errors, n 2, N 8)
a,b,c Mean values within a row with unlike superscript letters were significantly different (P<0.5).*Treatment means were analysed by one-way ANOVA with Tukey’s post hoc test of multiple comparisons. Effects of substrate, end product and substrate/end product interaction were analysed by two-way ANOVA.
† See Table 1 for experimental diet abbreviations.
‡ Fatty acids not recording any bioconversion (elongation or desaturation) are not reported in this table.
§ Not detected.
Acknowledgements
The authors gratefully acknowledge the assistance and support from Ridley Aquafeed (Brisbane, Australia). The authors also wish to thank Dr Karen Hermon, Mr Robert Collins and Ms Zoe Robertson for technical assistance and valuable contribution to this study.
The authors wish to declare funding and provision of dietary ingredients from Ridley Aquafeed (Brisbane, Australia) under the Deakin-Ridley Aquaculture Research Initiative.
T. S. M. conducted the experiment and subsequent analysis and wrote the manuscript. D. S. F. contributed to the concept and design of the experiment and critically revised the manuscript. M. K. J. assisted in conducting the experiment and subsequent analysis. B. D. G. contributed to the concept and design of the experiment and critically revised the manuscript. R. P. S. contributed to the concept and design of the experiment and critically revised the manuscript. G. M. T. contributed to the concept and design of the experiment and critically revised the manuscript.
The authors wish to declare funding and donation of materials for the growth trial from Ridley Aquafeed Ltd (Brisbane, Australia). The authors wish to clarify that the present trial compared experimental dietary lipid compositions in aquafeed and was not comparing commercially produced products by Ridley Aquafeed Ltd.


