


Taste is responsible for the discrimination between foods possessing a positive nutrient composition and substances that may be harmful. Five taste qualities including sweet, umami, bitter, salt and sour tastes provide key information regarding fitness of consumption for a vast array of chemical compounds( Reference Chaudhari and Roper 1 ).
The evidence supporting fat as an additional taste is compelling( Reference Chalé-Rush, Burgess and Mattes 2 – Reference Liu, Archer and Duesing 6 ). There are multiple putative oral peripheral mechanisms associated with fatty acid perception( Reference Liu, Archer and Duesing 6 ), including a number of candidate receptors and ion channels identified to be activated by fatty acids and trigger chemosensory pathway through Ca2+ cascade: CD36( Reference Baillie, Coburn and Abumrad 7 , Reference Laugerette, Passilly-Degrace and Patris 8 ), FFAR4 (GPR120), FFAR1 (GPR40)( Reference Briscoe, Tadayyon and Andrews 9 , Reference Kotarsky, Nilsson and Flodgren 10 ), FFAR3 (GPR41), FFAR2 (GPR43)( Reference Brown, Goldsworthy and Barnes 11 ), GPR84( Reference Wang, Wu and Simonavicius 12 ) and delayed rectifying K+ (DRK) channels( Reference Liu, Hansen and Kim 13 , Reference Gilbertson, Liu and York 14 ). The expression of the candidate receptors and the taste cell types that respond to free fatty acids has not been identified in human gustatory papillae. A comprehensive knowledge of the expression profile of the candidate fat taste receptors is an important step revealing the initial process for fat taste perception at the cellular level.
Taste cells embedded in the taste buds operate as the basic anatomical units for taste function. The taste buds are contained in the tiny bumps on the tongue known as the taste papillae. Three types of gustatory papillae are characterised according to their topographical representation – fungiform, foliate and circumvallate papillae on the anterior, lateral and posterior part of the tongue, respectively( Reference Chandrashekar, Hoon and Ryba 15 ). In addition, it is reported that there was no significant difference in sensitivity to fatty acids for the three types of the papillae( Reference Mattes 16 ), suggesting that all these papillae contain the biological machinery for fat taste detection. The taste cells are classified as four types based on their ultrastructure and function: Type I (basal), Type II (receptor), Type III (presynaptic) and Type IV cells( Reference Chaudhari and Roper 1 ).
Peripheral mechanisms for fat taste have been identified, albeit not in humans. CD36 is the best characterised receptor among the candidates and is able to detect long-chain fatty acids (LCFA)( Reference Febbraio, Hajjar and Silverstein 17 ). The evidence for CD36 function as a fat taste receptor includes both CD36 gene knockout in mice( Reference Laugerette, Passilly-Degrace and Patris 8 ) and in humans and the association of CD36 SNP rs1761667 with fatty acid taste sensitivity( Reference Liu, Archer and Duesing 6 , Reference Pepino, Love-Gregory and Klein 18 – Reference Melis, Sollai and Muroni 21 ). The G-protein-coupled receptors (GPCR) FFAR4 and FFAR1 are also candidates owing to the ability to bind medium-chain fatty acids (MCFA) and LCFA( Reference Briscoe, Tadayyon and Andrews 9 , Reference Kotarsky, Nilsson and Flodgren 10 ), and FFAR3, FFAR2 and GPR84 for SCFA( Reference Liu, Archer and Duesing 6 , Reference Kles and Chang 22 ). However, the absence of FFAR1 in human tongue papillae probably excludes the role of this candidate in human beings( Reference Galindo, Voigt and Stein 23 ). DRK channels were reported to respond to cis-PUFA (PUFA) and associated with fatty acid taste sensitivity in rodent models( Reference Gilbertson, Liu and York 14 , Reference Gilbertson, Leonardelli and Wolf 24 ). Nine types of the DRK channels (KCNA1, KCNA2, KCNA3, KCNA5, KCNA6, KCNB1, KCNB2, KCNC1 and KCNC2) have been well established in Xenopus oocytes or mammalian expression systems, among which KCNA5, KCNC1, KCNC2, KCNA2 and KCNB2 were expressed extensively in anterior rat taste buds( Reference Liu, Hansen and Kim 13 ), with no human study conducted to reveal the expression and function of these channels in human fat taste so far.
Marked individual variations in taste response of the taste system existed across all taste modalities( Reference Running and Hayes 25 , Reference Hayes, Feeney and Allen 26 ), which was also observed in fat taste( Reference Stewart, Feinle-Bisset and Golding 3 ). Both genetic and environmental factors were reported to be responsible for the variance. However, data investigating the factors have been controversial. Previous studies suggested that the sensitivity to 6-n-propylthiouracil (PROP), which was largely determined by the genotype, was associated with fat perception( Reference Tepper and Nurse 27 – Reference Hayes and Duffy 29 ), although this remains controversial( Reference Drewnowski, Henderson and Barratt-Fornell 30 – Reference Heinze, Preissl and Fritsche 32 ). However, using PROP as a taste function indicator was questioned in many studies based on the lack of correlations between PROP and taste sensitivity to different modalities( Reference Lim, Urban and Green 31 , Reference Kamerud and Delwiche 33 – Reference Yackinous and Guinard 35 ). Instead, taste papillae density was reported to be partially responsible for taste sensitivity( Reference Miller and Reedy 36 – Reference Zhang, Zhang and Wang 38 ), with limited studies on fat taste. Recently, variants of the fat taste receptors were associated with oral sensory of fatty acids. The SNP rs1761667 of CD36, which was associated with the expression level of this receptor, was correlated with sensitivity to fatty acids( Reference Pepino, Love-Gregory and Klein 18 , Reference Mizak, Sery and Plesnik 19 , Reference Melis, Sollai and Muroni 21 ). In addition, some other variants of CD36 and FFAR4 were related to the taste sensitivity to fatty acids( Reference Bokor, Legry and Meirhaeghe 39 – Reference Waguri, Goda and Kasezawa 42 ). It should be noted that some of the SNP such as rs9784998 of CD36 and rs116454156 of FFAR4 were also reported to influence the expression level of the receptors( Reference Love-Gregory, Sherva and Schappe 43 , Reference Vestmar, Andersson and Christensen 44 ). This may indicate potential associations between the expression level of the fat taste receptors and fatty acid perception. However, the correlation of fat taste function with the expression level of the fat taste receptors, especially for the GPCR and the DRK channels, remains a gap of our knowledge. For the environmental factor, dietary intake was associated with fat taste sensitivity( Reference Heinze, Costanzo and Baselier 45 ). In addition, other factors such as BMI( Reference Stewart, Feinle-Bisset and Golding 3 , Reference Asano, Hong and Matsuyama 46 – Reference Stewart, Seimon and Otto 48 ) and age( Reference Narukawa, Kurokawa and Kohta 49 ) were reported to be associated with taste sensitivity. As this study included twin participants with a high range of BMI and age, the mixed linear model adjusting for BMI and age, with twin as random effects, was applied to validate the correlations.
Regardless of the level of evidence that exists for each candidate, there is no study to date that has assessed all candidate receptors together and systematically in human taste papillae. This may be partially owing to the lack of reliable antibodies and difficulty in obtaining human taste tissue. The goal of this study was to identify the candidate fat taste receptors that were expressed in human fungiform papillae and their association with fat taste, thus providing the basis for further research to identify the mechanisms associated with fat perception in human oral cavity.
Methods
Study outline
This study was conducted according to the guidelines laid down in the Declaration of Helsinki, and all the experimental procedures were approved by the Commonwealth Scientific and Industrial Research Organisation (CSIRO) Human Research Ethics Committee (13/06) and ratified by the Deakin University Human Research Ethics Committee (2014-177). This study contained three cohorts: cohort 1 for gene and protein expression analysis, cohort 2 for immunohistochemistry staining and cohort 3 for association analysis. All participants gave the informed consent before participating in the study and had no history of any taste disorders.
For cohorts 1 and 2, a total of ten participants (six female and four male, aged between 20 and 42 years, with a BMI between 20 and 33 kg/m2) were recruited. For cohort 3, eight pairs of female twins (six monozygotic pairs and two dizygotic pairs, aged between 20 and 62 years, with a BMI between 17 and 35 kg/m2) were included as a subgroup from a larger project recruited by Twins Research Australia.
Fungiform papillae collection
For participants from all the three cohorts, fungiform papillae biopsy was conducted without anaesthetic by a registered doctor according to the procedure described previously( Reference Spielman, Pepino and Feldman 50 , Reference Archer, Liu and Shaw 51 ). The participants fasted overnight before papillae collection. For each participant, six fungiform papillae were collected and pooled as an individual sample. The ten samples collected from cohort 1 and 2 participants were randomly divided into two groups: five samples for RT-PCR analysis and western blotting for cohort 1 and five for immunohistochemistry of cohort 2.
Cohort 1 and 3 papillae samples were transferred to a vial containing RNALater (Life Technologies) immediately after excision and stored at −80°C before further processing. Cohort 2 papillae tissues were fixed for 3 h in 4 % neutral buffered formalin (Sigma-Aldrich) and then transferred into 70 % ethanol overnight to preserve antigenic epitopes.
RNA and protein extraction
To extract RNA and protein, papillae samples of cohorts 1 and 3 were thawed on ice, the RNALater supernatant was taken off and all papillae for each subject were homogenised with a motorised pestle (Sigma-Aldrich) in 1 ml of TRIzol reagent (Life Technologies). The samples were then passed through a 19-gauge needle fifteen times to ensure complete cell lysis. After phase separation with 200 μl of chloroform (Sigma-Aldrich), the RNA was extracted from the aqueous phase according to the manufacturer’s protocol( 52 ). The bottom organic layer was retained for protein extraction and was stored at −80°C for later extraction. The RNA pellet was dissolved in 20 μl of RNase-free water and treated with DNase to remove contaminating genomic DNA using the RNase-free DNase set (Qiagen). Each sample was then purified overnight by precipitation with 0·3 m sodium acetate, 2 μl of glycogen and 2·5 volumes of 100 % ethanol. After centrifuging and two ethanol washes on the next day, the RNA pellet was re-dissolved in 20 μl of RNase-free water. RNA concentrations were measured using the NanoDrop ND-1000 spectrophotometer (Thermo Fisher Scientific) and RNA integrity number (RIN, ranging from 0 to 10, with 10 indicating the greatest integrity) was assessed using a Bioanalyser 2100 (Agilent Technologies) using the Agilent RNA 6000 Nano Kit. The RNA samples were then stored at −80°C before further processing.
The bottom phenol–ethanol layer of cohort 1 samples was used to extract the protein according to the dialysis protocol of Hummon( Reference Hummon, Lim and Difilippantonio 53 ) with minor changes. In short, the samples were loaded in dialysis membranes (MWCO 6000; Spectra/Por) against three changes of 0·1 % sodium dodecyl sulfate (SDS) at 4°C for 16, 4 and 2 h continuously. The resultant mass was dissolved in 200 μl of SDS sample buffer (62·5 mm TRIS-HCl, 1 mm dithiothreitol, 2 % SDS, 10 % glycerol) containing protease inhibitor cocktail (Roche) at 50°C in a water bath for 15 min. The protein concentrations were estimated using the Pierce™ BCA protein assay kit (Life Technologies) and stored at −20°C.
Phenotyping tests
The participants for cohort 3 were asked to participate in a 2-h laboratory session one day before the papillae collection. The session was conducted in a temperature- and sound-controlled partitioned sensory booth consisting of four sub-sessions: (1) anthropometry measurement, which includes the body weight and height measurement without shoes and in light clothing; (2) three-pass 24-hour dietary recall( 54 ) conducted by a trained nutritionist; (3) detection threshold to oleic acid (C18 : 1) measurement with a duplicate ascending series 3-alternate force choice (3-AFC) methodology( Reference Haryono, Sprajcer and Keast 55 ); and (4) liking rating analysis for high-fat and low-fat foods based on seven pairs of high-fat foods and their reduced-fat counterparts. For the detection threshold and liking rating analysis, the samples were prepared according to the same procedure as detailed by( Reference Costanzo, Orellana and Nowson 56 ). After the sub-session 1, BMI was calculated as weight (kg)/height (m)2. The amount of energy intake (kJ), fat intake (in the unit of g, including total, saturated, polyunsaturated and monounsaturated fat intake) and the percentage of the energy derived from fat (including total, saturated, polyunsaturated and monounsaturated fat percentage) were calculated based on the data from the 24-h dietary recall using computer software FoodWorks (version 8; Xyris). Mean fat taste detection threshold (mm) was determined for each participant based on duplicate 3-AFC sessions, and transformed to an ordinal scale labelled as fat taste rank (ranging from 0 to 12, with higher ranks implying higher detection threshold)( Reference Costanzo, Orellana and Nowson 56 ). The liking scores of high fat and low fat rated from −100 to 100 were calculated based on the mean scores of the seven high-fat or low-fat foods. The liking difference scores were calculated based on the mean liking score of the high-fat foods minus that of the low-fat foods. The higher liking difference score indicated a higher level of the preference to high-fat food compared with low-fat food, and vice versa. The relative liking score was used in the following correlation analysis to eliminate the individual bias in the scores.
Quantitative RT-PCR analysis
The gene expression of all candidate fat taste receptors including CD36, the GPCR and the nine DRK channels was analysed with quantitative RT-PCR (qRT-PCR) initially. For the RNA samples extracted from cohort 1 and 3 samples, 1 μg of total RNA was used to synthesise complementary DNA (cDNA) using the High Capacity cDNA Reverse Transcription Kit (Applied Biosystems) and each cDNA sample was diluted 1:5 with RNase-free water. Standards were prepared with a serial dilution of 1:5 from the top standard (an aliquot of the all the 1:5 dilution cDNA samples). The gene expression of all candidate fat taste receptors including CD36, the GPCR and the DRK channels expressed extensively in Liu et al.( Reference Liu, Hansen and Kim 13 ) were quantified for cohort 1 samples using the Taqman gene expression assays as detailed in Table 1. Only the positively expressed genes were analysed with the corresponding Taqman gene expression assays (listed in Table 1) for cohort 3 samples. Four replicates of each cDNA sample were analysed in a 384-well plate format with the Lightcycler 480 Real-time PCR Instrument (Roche) and run for forty cycles of the PCR programme. For each gene analysis, a negative control of the sample that had not been reverse-transcribed and a positive control from RNA isolated from whole blood were included. GAPDH and RPLP0 were included as reference genes for normalising the transcript numbers. All genes analysed were found to be expressed in human whole blood according to the gene expression omnibus (GEO) profiles of National Centre for Biotechnology Information (https://www.ncbi.nlm.nih.gov/geoprofiles).
Table 1 Taqman expression assays for the quantitative RT-PCR analysis

Western blotting analysis
The genes that failed to be amplified in all of the five samples during the forty cycles from the last step were not proceeded to protein expression analysis. For the protein extracted from cohort 1 samples, same amount (20 μg) of each sample was boiled for 5 min in Pierce™ Lane Marker Reducing Sample Buffer (Life Technologies). All of the samples were then separated on 10 % Mini-PROTEAN® TGX™ Gel (Bio-Rad) and transferred onto the PVDF membranes (Bio-Rad). The membranes were then blocked with 5 % non-fat milk in TRIS Buffered Saline containing 0·1 % Tween-20 (TBST) for 1 h at room temperature before being incubated with the primary antibody (Table 2) at 4°C overnight. The specificity of the antibodies was validated with specific positive controls and negative controls (shown in the online Supplementary data). On the next day, all the membranes including the one incubated without the primary antibody were washed three times with 0·1 % TBST (10 min each) and then incubated with the corresponding conjugated secondary antibody (detailed in Table 2) for 1 h at room temperature. The final washes were conducted after incubation with 0·1 % TBST five times (5 min each). The immunoreactivity was then visualised using the ECL system (Bio-Rad).
Table 2 Primary and secondary antibodies used for western blotting analysis

* The secondary antibodies are all from Bio-Rad, used with a dilution of 1:3000.
Immunohistochemistry localisation
For cohort 2 papillae samples, individual papilla were oriented in a micro-well filled with 2 % agarose before embedding and sectioning to ensure that the papilla was sectioned in the longitudinal way. The solidified agarose containing papillae was then processed through the normal dehydration and paraffin infiltration procedure using a Tissue Processor (Leica TP1050), and was reorientated before embedding in paraffin. The 5-μm-thin serial sections were cut with a RM2235 Rotary microtome (Leica Microsystems), mounted on slides, air-dried and stored in cutting order in an airtight box at room temperature for immunostaining. To ensure the orientation of the section (longitudinal sections) and the detection of the possible taste bud structures, approximately every 5th section was routinely stained with haematoxylin–eosin (H&E), mounted and viewed using routine light microscopy. Once the taste buds were detected from the H&E staining, the neighbouring slides were chosen for the following immunohistochemistry staining.
The candidate receptors and ion channels were stained using either immunofluorescence (FFAR4, GPR84 and KCNA2) or immunoperoxidase labelling (CD36 and FFAR2) based on the results of a pilot antibody optimisation study. For immunofluorescence staining, the paraffin sections were first deparaffinised with three xylene washes and rehydrated in a descending series of alcohol using 100, 75 and 50 % ethanol. Sections were then treated with 0·1 m sodium citrate buffer (pH 6·0) for 2 min in a microwave at 1000 W for antigen retrieval. After being rinsed with PBS, the slides were blocked with Image-iT FX signal enhancer (I36933; Life Technologies) for 30 min, followed by incubation in 10 % normal donkey serum (NDS) in PBST (0·3 % Triton X100 in PBS) with 1 % bovine serum albumin (BSA) for 1 h at room temperature. The sections were incubated with anti-PLCβ2 (sc-31757; Santa Cruz Biotechnology) diluted 1 part in 50 with 2 % NDS overnight at 4°C and thoroughly rinsed with PBS. Finally, the sections were incubated with the donkey anti-goat IgG (H+L) conjugated with Alexa 488 (A-150129; Life Technologies), 1:500 for 1 h at room temperature and mounted in Fluoroshield with DAPI (Sigma-Aldrich) and viewed using an inverted fluorescence microscope (Nikon) with image acquisition controlled by the NIS Elements AR 4.30.00 software (Nikon).
For immunoperoxidase labelling, sections were deparaffinised and rehydrated, and the endogenous alkaline phosphatase and peroxidase activity was inhibited with BLOXALL blocking solution (Vector Laboratories), followed by the antigen retrieval process described previously. After being rinsed in PBS, the sections were blocked for 30 min with 5 % BSA in PBST at room temperature. The primary antibodies (detailed in Table 3) were diluted in Da Vinci green antibody diluent (Biocare Medical) at a concentration ranging from 5 to 20 µg/ml or neat universal control Ig overnight at 4°C. After several PBS washes, the sections were incubated with either goat anti-mouse or goat anti-rabbit biotinylated secondary antibody (Zymed Laboratories) for 30 min at 37°C. Next, the sections were rinsed and incubated with streptavidin-HRP (streptavidin-horseradish peroxidase; Vector Laboratories) for 30 min. After the unbound streptavidin-HRP was removed by thoroughly rinsing with PBS, the DAB system (Vector Laboratories) was applied for signal detection. The sections were counterstained with haematoxylin and mounted after the final wash. Stained sections were viewed using bright-field microscopy on the same inverted microscope (Nikon) with the same acquisition system. For both staining methods, a negative control (isotype control) of the Ig from the same species of the animal (gift from Dr M. D. M. E. from CSIRO Agriculture & Food) as the primary antibody was run simultaneously with all the sections in order to verify the positive signals of the result. All of the images were captured at the same exposure time for specific magnification.
Table 3 Primary antibodies used in the immunohistochemistry analysis

* The secondary antibodies are from Life Technologies, used with a dilution of 1:500.
† The secondary antibodies are from Zymed Laboratories, used with a dilution of 1:50.
Statistics
The expression level of a target gene was calculated using the relative quantification of the target gene against two reference genes (arithmetic mean of RPLP0 and GAPDH transcripts). Standard curves were generated to determine the amplification efficiency (10−1/m, where m is the gradient of the standard curve) of the PCR reaction. The minimally detectable effect size |ρ| was 0·64 determined by Gpower (version 3.1.9.2) with α (probability of type I error) of 0·05, 80 % power and the sample size of 16 (two tails). The statistical analysis for the correlation study was conducted using SPSS package (version 24.0). At first, the normality of the gene expression level in terms of the relative transcript numbers resulted from qRT-PCR and the phenotyping data were assessed in the Shapiro–Wilk test to indicate whether they followed the normal distribution. The correlation analysis was first estimated with either Pearson’s moment correlation coefficient (R) for normal distributed pairs of interested variances or Spearman’s rank correlation coefficient (ρ) for the other pairs. Then linear mixed-effects models were conducted to assess the associations between pairs of interested variables including age and BMI as fixed effects and the twin pair as a random effect to validate the associations. Age and BMI were included as covariates to adjust for the effect on taste. The statistical significance was set at P<0·05.
Results
Gene expression of the candidate fat taste receptor genes
High-quality RNA was extracted from biopsied fungiform papillae with Bioanalyser RIN values between 7·5 and 9·2. Gene expression was observed for CD36, FFAR4, FFAR2, GPR84 and KCNA2 in all of the fungiform papillae samples. Fig. 1 shows the normalised transcripts level of each gene in the five papillae samples. Considerable amplification of the genes CD36, FFAR4, FFAR2, GPR84 and KCNA2 was observed in all of the samples after forty PCR cycles. No gene expression was observed for FFAR1, FFAR3, KCNA5 and KCNC1 in any of the samples, suggesting that these are unlikely to function as candidate fat taste receptors in human fungiform papillae. KCNB2 and KCNC2 showed low levels of amplification, including no amplification in some of the samples. All Taqman assays resulted in amplification of positive controls (RNA samples from whole blood) and no amplification of negative controls (samples without being reverse-transcribed).
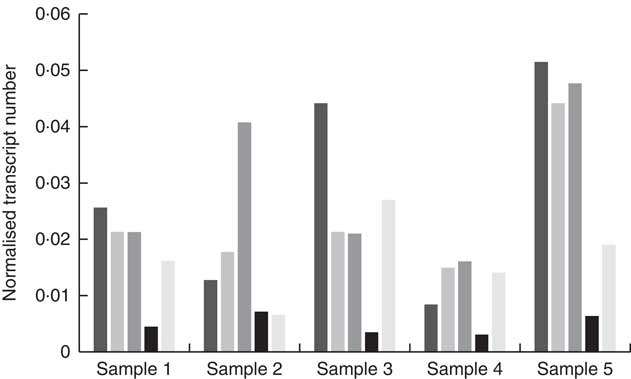
Fig. 1 Quantitative RT-PCR results of the candidate fat taste receptors and delayed rectifying K+ channels in human fungiform papillae. The relative transcript numbers represent transcript numbers normalised against the averaged transcript number of the housekeeping genes (RPLP0 and GAPDH). ![]() , CD36;
, CD36; ![]() , FFAR4;
, FFAR4; ![]() , FFAR2;
, FFAR2; ![]() , GPR84;
, GPR84; ![]() , KCNA2.
, KCNA2.
Detection of the candidate fat taste receptor proteins
Western blot analysis was completed to confirm expression for the positively expressed genes identified by the qRT-PCR in the same fungiform papillae samples. All of the candidate receptor and DRK channel proteins were detected from the human fungiform papillae protein lysates (Fig. 2).
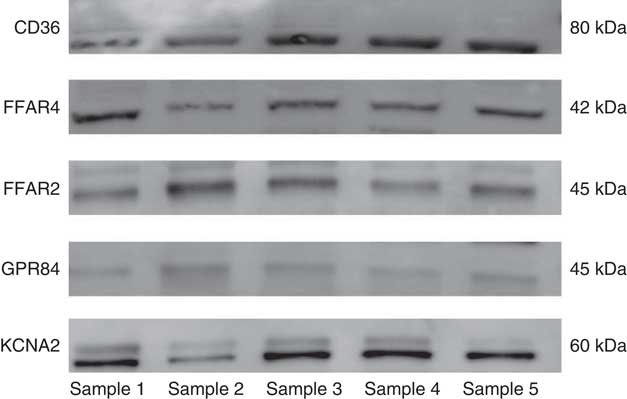
Fig. 2 Western blot results of the candidate fat taste receptor and delayed rectifying K+ channel proteins having positive gene expression from human fungiform papillae.
Localisation of the fat taste receptors in human fungiform taste buds
The candidate fat taste receptors displaying positive gene and protein expression profiles in human fungiform papillae were next assessed using immunohistochemistry analysis to identify the specific cell/tissue type origin (i.e. was expression originating from the taste bud, or another cell type). H&E staining of papillae sections revealed that approximately 20 % sections contained obvious taste bud structures (Fig. 3(a), dashed circles).

Fig. 3 Representative images of positive taste bud structures in fungiform papillae sections stained with (a) haematoxylin–eosin (H&E) and the selected panel of antibodies (b) FFAR4, (c) GPR84, (d) KCNA2, (e) CD36 and (f) FFAR2 and (g–i) negative controls, performed using either immunoperoxidase (e, f, h, i) or fluorescent-conjugated secondary antibodies (b, c, d, g). The dashed circles denote identifiable taste bud structures in each section. Scale bars represent 50 µm in the H&E-stained section (a), fluorescent images (b, c, d, g) and in immunoperoxidase images (e, f, h, i).
The immunoenzymatic staining results (Fig. 3) show that the positively expressed candidates that resulted from western blots were present in fungiform taste buds. The taste bud structures (highlighted with dashed circles in Fig. 3) were identified alongside the corresponding light image from the same panel where the fluorescence figures were taken. The positive signals were verified when they were absent from the corresponding negative control slides (Fig. 3(g)–(i)). Receptors for LCFA (CD36 and FFAR4), MCFA (GPR84), SCFA (FFAR2) and cis-PUFA (KCNA2) were identified in human fungiform papillae, in an outcome that was consistent with the expression data from the western blotting technique (as presented in Fig. 2). All of the candidate receptors were also located in taste buds, although some of the staining was faint in the taste tissue (for GPR84 and FFAR2). Besides the taste buds, the receptors CD36, FFAR2 and the DRK channels had positive expression present in other tissue types in the fungiform papillae. The receptors FFAR4 and GPR84 showed expression specifically in taste cells only. From the gene, protein expression and immunohistochemistry localisation studies, CD36, FFAR4, FFAR2, GPR84 and KCNA2 were analysed with the following correlation study.
Correlation of the fat taste receptors and fat taste phenotypes
The distribution of the relative expression levels of CD36 and KCNA2 from qRT-PCR and all the phenotyping factors was normal (P>0·05 from Shapiro–Wilk test), whereas the expression levels for FFAR2, FFAR4 and GPR84 were not. Therefore, the correlation coefficient for the expression level of CD36 and KCNA2 and the fat taste function indicators was estimated with the Pearson’s correlation analysis, whereas the other genes were analysed with Spearman’s ρ. The correlation coefficients and the P values are shown in Table 4. From the analysis, the expression level of CD36 presented a negative correlation with the preference to high-fat foods (indicated by the liking difference score) and a positive association with total fat, saturated fat intake and the energy from saturated fat proportion in 24 h. In addition, the expression level of FFAR2 was negatively associated with energy intake, saturated fat intake and monounsaturated fat intake for 24 h. No correlations of the detection threshold to oleic acid or unsaturated fat intake was observed for any of the taste receptor genes. The significant correlations were validated in the mixed model regression analysis, taking twin pair as a random effect and adjusted for age and BMI. After taking the twin pair, age and BMI into consideration, the significant association was observed for expression level of CD36 with the liking difference score (β=−0·04, P=0·04), FFAR2 with total fat intake (β=−0·01, P=0·003) and saturated fat intake (β=−0·02, P=0·008) for 24 h. The other significant correlations were not observed with twin pair as random effect and age and BMI as fixed effects.
Table 4 Correlation analysis of the expression level of fat taste receptor genes and fat taste function based on Pearson’s (P) and Spearman’s (S) coefficientsFootnote ‡

* Correlation is significant at the 0·05 level (two-tailed).
† Correlation is significant at the 0·01 level (two-tailed).
‡ The correlations are for descriptive purposes. Correlation coefficients were R and ρ for Pearson’ moment test and Spearman’s rank test, respectively.
Discussion
This study is the first to systematically examine putative candidate receptors responsible for fat taste in human fungiform papillae. Previous studies identified CD36 in human tongue papillae( Reference Simons, Kummer and Luiken 57 , Reference Ozdener, Subramaniam and Sundaresan 58 ) and FFAR4 in human taste tissue of fungiform papillae( Reference Ozdener, Subramaniam and Sundaresan 58 ) and circumvallate papillae( Reference Galindo, Voigt and Stein 23 ). From the gene and protein expression analysis result in our study, CD36, FFAR4, FFAR2, GPR84 and certain types of DRK channels, such as KCNA2, are present in human fungiform papillae samples. The quantitative analysis of the gene expression levels further indicated significant correlations among many of the fat receptor genes. The immunostaining serves to confirm the expression of their protein products, further underscoring the likely role they may play in identification of the fatty acids in foods. These candidate receptors, as well as some of the others not seen in fungiform papillae, may be present in other types of gustatory papillae in the human oral cavity. Therefore, the absence of receptors in fungiform papillae does not exclude their role in fat taste perception in human. It should also be noted that candidate fat taste receptors are present broadly in other tissues and performed different roles. For example, CD36 expression has been identified in blood and involved with cell adhesion( Reference Cortés, Mellombo and Mgone 59 ) and digestive secretion( Reference Laugerette, Passilly-Degrace and Patris 60 ).
Our study shows a divergent expression profile of the candidate fat taste receptors in humans compared with rodent models. For example, KCNA5, serving as the major DRK channel expressed in rat tongue( Reference Liu, Hansen and Kim 13 ), was not identified in the human fungiform papillae. In contrast, KCNA2 appears to be the most abundant DRK channel in human fungiform papillae. The expression analysis revealed by qRT-PCR also indicates that the predominant sub-family of the DRK channels in human fungiform papillae appears to be the Shaker channels (KCNA) rather than the Shab (KCNB) or Shaw (KCNC) channels, which is consistent with rodent models( Reference Liu, Hansen and Kim 13 ). The candidate DRK channels selected were based on the DRK expression analysis from rat( Reference Liu, Hansen and Kim 13 ), but as there appears divergent expression profiles between rat and human, there might be other DRK channels expressed in human that do not overlap with those identified in rodent models. Future studies are required to explore the expression profile of further DRK channel types in relation to their function in human fat taste.
Another main distinction is the absence of FFAR1 and FFAR3 in human fungiform papillae. FFAR1 has been reported to expand the types of fat stimuli with its affinity to shorter MCFA( Reference Itoh, Kawamata and Harada 61 ) and was found to be expressed in mice circumvallate papillae( Reference Cartoni, Yasumatsu and Ohkuri 62 ). However, FFAR1 was not expressed in human fungiform papillae in a previous study( Reference Galindo, Voigt and Stein 23 ), which was consistent with what was found in this study. Although FFAR1 was absent in human fungiform papillae, the existence of GPR84 in taste buds of the tongue papillae fills in the gap of the detection of certain MCFA, as some of the agonists overlap between FFAR1 and GPR84( Reference Wang, Wu and Simonavicius 12 ). In addition, the expression of GPR84 in granulocytes suggests a potential role it might play in the immune system of the oral cavity( Reference Yousefi, Cooper and Potter 63 ).
FFAR3 and FFAR2 were always reported by previous studies simultaneously as they belong to a sub-family of homologous GPCR. They are both tuned to SCFA such as acetic acid, and trigger the similar downstream signal transduction pathway, albeit through different mediators( Reference Brown, Goldsworthy and Barnes 11 ). Although controversies arose when it was shown that the taste perception of SCFA overlaps largely with sour taste( Reference Running, Craig and Mattes 5 ), the signal transduction mechanisms for SCFA and common sour stimuli showed inconsistency. Data from previous studies attempting to validate the candidate sour taste receptor-polycystic kidney disease (PKD) channels showed that acetic acids triggers a response of non-transfected human HEK293T cells (highly transfectable derivative of human embryonic kidney 293 cells), as well as PKD1L3- and/or PDK2L1-transfected HEK293T cells, which was not identified for other acid solutions tested( Reference Inada, Kawabata and Ishimaru 64 , Reference Ishii, Misaka and Kishi 65 ). The expression of FFAR3 and FFAR2 in kidney cells( Reference Pluznick 66 ) might explain the increase in intracellular calcium ion concentration evoked by acetic acids independent from the PKD channel pathway. In the current study, FFAR2 was identified in human fungiform papillae, including the taste bud tissue, whereas FFAR3 was absent. This was not unexpected as the expression of the two receptors is reported to be highly tissue specific: FFAR2 is reported to be expressed predominantly in immune cells such as neutrophils and monocytes( Reference Nilsson, Kotarsky and Owman 67 , Reference Senga, Iwamoto and Yoshida 68 ) and FFAR3 mainly in blood mononuclear cells and adipose tissue( Reference Brown, Goldsworthy and Barnes 11 , Reference Le Poul, Loison and Struyf 69 ).
Most of previous studies associated the oral sensory perception of fatty acids with CD36, FFAR4 and FFAR1. A major finding from the association analysis is that CD36 showed a significant negative association with the difference in liking between high-fat and low-fat foods. As obese individuals showed a preference for diets higher in fat content( Reference Drewnowski 70 ), CD36 may play a role in the development of obesity through regulating fat sensing. Previous studies showed a negative correlation between the detection threshold to C18 : 1 and the expression level of CD36( Reference Pepino, Love-Gregory and Klein 18 ). However, none of the genes showed a significant correlation with the detection threshold to C18 : 1 in this study, which could be owing to the small sample size or large variability between populations. As this study is part of a large project, the sample size is underpowered to detect all associations. Besides, genetic variants on chemosensory receptors across populations were reported to be associated with taste perception and food habits( Reference Risso, Giuliani and Antinucci 71 ). The variants that were not associated with the expression of the fat taste receptors could also play a role in fat taste functions and introduce large deviations in the association analysis. The genotypes of the taste receptor genes were not analysed in this study, but could also have yielded insights into the association analysis. Our association analysis also showed that FFAR2 expressed in human fungiform papillae was related to the fat intake. Future functional analysis is required to validate the roles these fat taste receptors play in oral fat perception.
The presence of multiple receptors and mechanisms responsive to fatty acids on taste cells implies that a sophisticated system may underpin fat taste perception. A crosstalk model that combines multiple receptors and ion channels has been previously proposed( Reference Abdoul-Azize, Selvakumar and Sadou 72 , Reference Gilbertson and Khan 73 ), although this is controversial( Reference Liu, Archer and Duesing 6 ). Here we have identified several receptors in taste tissue that possess the ability to bind fatty acids, which suggests a crosstalk model or, alternatively, different receptors tuned to different fatty acid lengths/types may also be possible. By assessing systematically the expression profile of all candidate fatty acid taste receptors reported thus far, this work provides a platform for further research to identify the receptor(s) and mechanism(s) for the detection of fatty acids in humans. Future co-localisation studies are required to identify taste cell sub-type and co-expression patterns of the candidate receptors in human taste tissue. Additionally, the response of the candidate receptors to dietary intervention would assist in further elucidating the mechanism(s) of fatty acid taste detection.
Acknowledgements
The authors express gratitude to the study volunteers who donated samples.
This work was funded by the National Health and Medical Research Council (NH&MRC) grant 104780.
The study was designed by D. L., N. S. A., K. D. and R. K. D. L. conducted the experiments, analysed the data and wrote the paper. A. C. contributed to the phenotyping tests. M. D. M. E., N. S. A. and K. D. contributed to the development of the methodology and provided technical assistance. R. K., K. D. and C. N. contributed to the acquisition of the funding and supervision of the project. All authors reviewed the results and approved the final version of the manuscript.
The authors declare that there are no conflicts of interest.
Supplementary material
For supplementary material/s referred to in this article, please visit https://doi.org/10.1017/S0007114518001265


