
Abstract
Scale-invariant interest points have found several highly successful applications in computer vision, in particular for image-based matching and recognition.
This paper presents a theoretical analysis of the scale selection properties of a generalized framework for detecting interest points from scale-space features presented in Lindeberg (Int. J. Comput. Vis. 2010, under revision) and comprising:
-
an enriched set of differential interest operators at a fixed scale including the Laplacian operator, the determinant of the Hessian, the new Hessian feature strength measures I and II and the rescaled level curve curvature operator, as well as
-
an enriched set of scale selection mechanisms including scale selection based on local extrema over scale, complementary post-smoothing after the computation of non-linear differential invariants and scale selection based on weighted averaging of scale values along feature trajectories over scale.
It is shown how the selected scales of different linear and non-linear interest point detectors can be analyzed for Gaussian blob models. Specifically it is shown that for a rotationally symmetric Gaussian blob model, the scale estimates obtained by weighted scale selection will be similar to the scale estimates obtained from local extrema over scale of scale normalized derivatives for each one of the pure second-order operators. In this respect, no scale compensation is needed between the two types of scale selection approaches. When using post-smoothing, the scale estimates may, however, be different between different types of interest point operators, and it is shown how relative calibration factors can be derived to enable comparable scale estimates for each purely second-order operator and for different amounts of self-similar post-smoothing.
A theoretical analysis of the sensitivity to affine image deformations is presented, and it is shown that the scale estimates obtained from the determinant of the Hessian operator are affine covariant for an anisotropic Gaussian blob model. Among the other purely second-order operators, the Hessian feature strength measure I has the lowest sensitivity to non-uniform scaling transformations, followed by the Laplacian operator and the Hessian feature strength measure II. The predictions from this theoretical analysis agree with experimental results of the repeatability properties of the different interest point detectors under affine and perspective transformations of real image data. A number of less complete results are derived for the level curve curvature operator.
1 Introduction
The notion of scale selection is essential to adapt the scale of processing to local image structures. A computer vision system equipped with an automatic scale selection mechanism will have the ability to compute scale-invariant image features and thereby handle the a priori unknown scale variations that may occur in image data because of objects and substructures of different physical size in the world as well as objects at different distances to the camera. Computing local image descriptors at integration scales proportional to the detection scales of scale-invariant image features, moreover makes it possible to compute scale-invariant image descriptors (Lindeberg [35]; Bretzner and Lindeberg [4]; Mikolajczyk and Schmid [49]; Lowe [48]; Bay et al. [2]; Lindeberg [38, 43]).
A general framework for performing scale selection can be obtained by detecting local extrema over scale of γ-normalized derivative expressions (Lindeberg [35]). This approach has been applied to a large variety of feature detection tasks (Lindeberg [34]; Bretzner and Lindeberg [4]; Sato et al. [54]; Frangi et al. [11]; Krissian et al. [22]; Chomat et al. [5]; Hall et al. [15]; Mikolajczyk and Schmid [49]; Lazebnik et al. [24]; Negre et al. [52]; Tuytelaars and Mikolajczyk [58]). Specifically, highly successful applications can be found in image-based recognition (Lowe [48]; Bay et al. [2]). Alternative approaches for scale selection have also been proposed in terms of the detection of peaks over scale in weighted entropy measures (Kadir and Brady [18]) or Lyapunov functionals (Sporring et al. [56]), minimization of normalized error measures over scale (Lindeberg [36]), determining minimum reliable scales for feature detection according a noise suppression model (Elder and Zucker [9]), determining optimal stopping times in non-linear diffusion-based image restoration methods using similarity measurements relative to the original data (Mrázek and Navara [51]), by applying statistical classifiers for texture analysis at different scales (Kang et al. [19]) or by performing image segmentation from the scales at which a supervised classifier delivers class labels with the highest posterior (Loog et al. [47]; Li et al. [25]).
Recently, a generalization of the differential approach for scale selection based on local extrema over scale of γ-normalized derivatives has been proposed by linking image features over scale into feature trajectories over scale in a generalized scale-space primal sketch [39]. Specifically, two novel scale selection mechanisms have been proposed in terms of:
-
post-smoothing of differential feature responses by performing a second-stage scale-space smoothing step after the computation of non-linear differential invariants, so as to simplify the task of linking feature responses over scale into feature trajectories, and
-
weighted scale selection where the scale estimates are computed by weighted averaging of scale-normalized feature responses along each feature trajectory over scale, in contrast to previous detection of local extrema or global extrema over scale.
The subject of this article is to perform an in-depth theoretical analysis of properties of these scale selection methods when applied to the task of computing scale-invariant interest points:
-
(i)
When using a set of different types of interest point detectors that are based on different linear or non-linear combinations of scale-space derivatives, a basic question arises of how to relate thresholds on the magnitude values between different types of interest point detectors. By studying the responses of the different interest point detectors to unit contrast Gaussian blobs, we will derive a way of expressing mutually corresponding thresholds between different types of interest points detectors. Algorithmically, the resulting threshold relations lead to intuitively very reasonable results.
-
(ii)
The new scale selection method based on weighted averaging along feature trajectories over scale raises questions of how the properties of this scale selection method can be related to the previous scale selection method based on local extrema over scale of scale-normalized derivatives. We will show that for Gaussian blobs, the scale estimates obtained by weighted averaging over scale will be similar to the scale estimates obtained from local extrema over scale. If we assume that scale calibration can be performed based on the behaviour for Gaussian blobs, this result therefore shows that no relative scale compensation is needed between the two types of scale selection approaches. In previous work on scale selection based on γ-normalized derivatives [34, 35] a similar assumption of scale calibration based on Gaussian model signals has been demonstrated to lead to highly useful results for calibrating the value of the γ-parameter with respect to the problems of blob detection, corner detection, edge detection and ridge detection, with a large number of successful computer vision applications building on the resulting feature detectors.
-
(iii)
For the scale linking algorithm presented in [39], which is based on local gradient ascent or gradient decent starting from local extrema in the differential responses at adjacent levels of scale, it turns out that a second post-smoothing stage after the computation of non-linear differential invariants is highly useful for increasing the performance of the scale linking algorithm, by suppressing spurious responses of low relative amplitude in the non-linear differential responses that are used for computing interest points. This self-similar amount of post-smoothing is determined as a constant times the local scale for computing the differential expressions, and may affect the scale estimates obtained from local extrema over scale or weighted averaging over scale. We will analyze how large this effect will be for different amounts of post-smoothing and also show how relative scale normalization factors can be determined for the different differential expressions to obtain scale estimates that are unbiased with respect to the effect of the post-smoothing operation, if we again assume that scale calibration can be performed based on the scale selection properties for Gaussian blobs. Notably, different scale compensation factors for the influence of post-smoothing will be obtained for the different differential expressions that are used for defining interest points. Without post-smoothing, the scale estimates obtained from the different differential expressions are, however, all similar for Gaussian blobs, which indicates the possibilities of using different types of differential expressions for performing combined interest point detection and scale selection, so that they can be interchangeably replaced in a modular fashion.
-
(iv)
When detecting interest points from images that are taken of an object from different viewing directions, the local image pattern will be deformed by the perspective projection. If the interest point corresponds to a point in the world that is located at a smooth surface of an object, this deformation can to first order of approximation be modelled by a local affine transformation (Gårding and Lindeberg [12]). While the notion of affine shape adaptation has been demonstrated to be a highly useful tool for computing affine invariant interest points (Lindeberg and Gårding [46]; Baumberg [1]; Mikolajczyk and Schmid [49]; Tuytelaars and van Gool [57]), the success of such an affine shape adaptation process depends on the robustness of the underlying interest points that are used for initiating the iterative affine shape adaptation process. To investigate the properties of the different interest point detectors under affine transformations, we will perform a detailed analysis of the scale selection properties for affine Gaussian blobs, for which closed form theoretical analysis is possible. The analysis shows that the determinant of the Hessian operator and the new Hessian feature strength measure I do both have significantly better behaviour under affine transformations than the Laplacian operator or the new Hessian feature strength measure II. In comparison with experimental results [39], the interest point detectors that have the best theoretical properties under affine transformations of Gaussian blob do also have significantly better repeatability properties under affine and perspective transformations than the other two. These results therefore show how experimental properties of interest points can be predicted by theoretical analysis, which contributes to an increased understanding of the relative properties of different types of interest point detectors.
In very recent work [42], these generalized scale-space interest points have been integrated with local scale-invariant image descriptors and been demonstrated to lead to highly competitive results for image-based matching and recognition.
1.1 Outline of the Presentation
The paper is organized as follows. Section 2 reviews main components of a generalized framework for detecting scale-invariant interest points from scale-space features, including a richer set of interest point detectors at a fixed scale as well as new scale selection mechanisms.
In Sect. 3 the scale selection properties of this framework are analyzed for scale selection based on local extrema over scale of γ-normalized derivatives, when applied to rotationally symmetric as well as anisotropic Gaussian blob models. Section 4 gives a corresponding analysis for scale selection by weighted averaging over scale along feature trajectories.
Section 5 summarizes and compares the results obtained from the two scale selection approaches including complementary theoretical arguments to highlight their similarities in the rotationally symmetric case. It is also shown how scale calibration factors can be determined so as to obtain comparable scale estimates from interest point detectors that have been computed from different types of differential expressions. Comparisons are also presented of the relative sensitivity of the scale estimates to affine transformations outside the similarity group, with a brief comparison to experimental results. Finally, Sect. 6 concludes with an overall summary and discussion.
2 Scale-Space Interest Points
2.1 Scale-Space Representation
The conceptual background we consider for feature detection is a scale-space representation (Iijima [17]; Witkin [62]; Koenderink [20]; Koenderink and van Doorn [21]; Lindeberg [30, 31]; Florack [10]; Weickert et al. [60]; ter Haar Romeny [14]; Lindeberg [38, 40]) L:ℝ2×ℝ+→ℝ computed from a two-dimensional signal f:ℝ2→ℝ according to
where g:ℝ2×ℝ+→ℝ denotes the (rotationally symmetric) Gaussian kernel
and the variance t=σ 2 of this kernel is referred to as the scale parameter. Equivalently, this scale-space family can be obtained as the solution of the (linear) diffusion equation
with initial condition \(L(\cdot, \cdot;\; t) = f\). From this representation, scale-space derivatives or Gaussian derivatives at any scale t can be computed either by differentiating the scale-space representation or by convolving the original image with Gaussian derivative kernels:
where α and β∈ℤ+.
2.2 Differential Entities for Detecting Scale-Space Interest Points
A common approach to image matching and object recognition consists of matching interest points with associated image descriptors. Basic requirements on the interest points on which the image matching is to be performed are that they should (i) have a clear, preferably mathematically well-founded, definition, (ii) have a well-defined position in image space, (iii) have local image structures around the interest point that are rich in information content such that the interest points carry important information to later stages and (iv) be stable under local and global deformations of the image domain, including perspective image deformations and illumination variations such that the interest points can be reliably computed with a high degree of repeatability. The image descriptors computed at the interest points should also (v) be sufficiently distinct, such that interest points corresponding to physically different points can be kept separate.
Preferably, the interest points should also have an attribute of scale, to make it possible to compute reliable interest points from real-world image data, including scale changes in the image domain. Specifically, the interest points should preferably also be scale-invariant to make it possible to match corresponding image patches under scale variations.
Within this scale-space framework, interest point detectors can be defined at any level of scale using
-
(i)
either of the following established differential operators [35]:
-
the Laplacian operator
$$ \nabla^2 L = L_{xx} + L_{yy} $$(5) -
the determinant of the Hessian
$$ \det {\mathcal{H}} L = L_{xx} L_{yy} - L_{xy}^2 $$(6) -
the rescaled level curve curvature
$$ \tilde{\kappa}(L) = L_x^2 L_{yy} + L_y^2 L_{xx} - 2 L_x L_y L_{xy} $$(7)
-
-
(ii)
either of the following new differential analogues and extensions of the Harris operator [16] proposed in [39]:
-
the unsigned Hessian feature strength measure I
$$ {\mathcal{D}}_1 L = \left \{ \begin{array}{l} \det {\mathcal{H}} L - k \, \operatorname {trace}^2 {\mathcal{H}} L\\ [3pt] \quad \mbox{if $\det {\mathcal{H}} L - k \, \operatorname {trace}^{2} {\mathcal{H}} L > 0$} \\[3pt] 0 \quad \mbox{otherwise} \end{array} \right . $$(8) -
the signed Hessian feature strength measure I
$$ \tilde{\mathcal{D}}_1 L = \left \{ \begin{array}{l} \det {\mathcal{H}} L - k \, \operatorname {trace}^2 {\mathcal{H}} L\\ [3pt] \quad \mbox{if $\det {\mathcal{H}} L - k \, \operatorname {trace}^{2} {\mathcal{H}} L > 0$} \\[3pt] \det {\mathcal{H}} L + k \, \operatorname {trace}^2 {\mathcal{H}} L\\[3pt] \quad \mbox{if $\det {\mathcal{H}} L + k \, \operatorname {trace}^{2} {\mathcal{H}} L < 0$} \\ 0 \quad \mbox{otherwise} \end{array} \right . $$(9)
where \(k \in ]0, \frac{1}{4}[\) with the preferred choice k≈0.04, or
-
-
(iii)
either of the following new differential analogues and extensions of the Shi and Tomasi operator [55] proposed in [39]:
-
the unsigned Hessian feature strength measure II
$$ {\mathcal{D}}_2 L = \min (| \lambda_1|, |\lambda_2| ) = \min (|L_{pp}|, |L_{qq}| ) $$(10) -
the signed Hessian feature strength measure II
$$ \tilde{\mathcal{D}}_2 L = \left \{ \begin{array}{l@{\quad}l} L_{pp} & \mbox{if $|L_{pp}| < |L_{qq}|$} \\[3pt] L_{qq} & \mbox{if $|L_{qq}| < |L_{pp}|$} \\[3pt] (L_{pp} + L_{qq})/2 & \mbox{otherwise} \end{array} \right . $$(11)
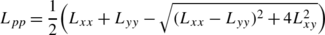
where L pp and L qq denote the eigenvalues of the Hessian matrix (the principal curvatures) ordered such that L pp≤L qq [34]:
 (12)
(12) (13)
(13) -


Figure 1 shows examples of detecting different types of interest points from a grey-level image. In this figure, the repetitive nature of the underlying image structures in the row of similar books illustrate the ability of the interest point detectors to respond to approximately similar structures in the image domain by corresponding responses. Figure 2 illustrates the repeatability properties of such interest points more explicitly, by detecting signed Hessian feature strength \(\tilde{\mathcal{D}}_{1,\mathit{norm}} L\) interest points from two images of a building taken from different perspective views.

Scale-invariant interest points detected by linking (top left) Laplacian \(\nabla_{\mathit{norm}}^{2} L\) features, (top right) determinant of the Hessian \(\det {\mathcal{H}}_{\mathit{norm}} L\) features, (middle left) signed Hessian feature strength measure \(\tilde{\mathcal{D}}_{1,\mathit{norm}} L\) features, (middle right) signed Hessian feature strength measure \(\tilde{\mathcal{D}}_{2,\mathit{norm}} L\) features, (bottom left) rescaled level curve curvature \(\tilde{\kappa}_{\gamma-\mathit{norm}}(L)\) features and (bottom right) scale-linked Harris-Laplace features over scale into feature trajectories and performing scale selection by weighted averaging of scale values along each feature trajectory. The 500 strongest interest points have been extracted and drawn as circles with the radius reflecting the selected scale measured in units of \(\sigma = \sqrt{t}\). Positive responses of the differential expression \({\mathcal{D}} L\) are shown in red and negative responses in blue. (Image size: 725×480 pixels. Scale range: t∈[4,512])

Illustration of the repeatability properties of the interest points by detecting signed Hessian feature strength \(\tilde{\mathcal{D}}_{1,\mathit{norm}} L\) interest points from two images of a building taken from different perspective views, by linking image features over scale into feature trajectories and performing scale selection by weighted averaging of scale values along each feature trajectory. The 1000 strongest interest points have been extracted and drawn as circles with the radius reflecting the selected scale measured in units of \(\sigma = \sqrt{t}\). Interest points that have a positive definite Hessian matrix are shown in blue (dark features), interest points with negative definite Hessian matrix are shown in red (bright features) whereas interest points with an indefinite Hessian matrix are marked in green (saddle-like features). (Image size: 816×540 pixels. Scale range: t∈[4,256])
A basic motivation for defining the new differential operators \({\mathcal{D}}_{1}\), \(\tilde{\mathcal{D}}_{1}\), \({\mathcal{D}}_{2}\) and \(\tilde{\mathcal{D}}_{2}\) from the Hessian matrix \({\mathcal{H}} L\) in a structurally related way as the Harris and the Shi-and-Tomasi operators are defined from the second-moment matrix (structure tensor) are that: (i) under an affine transformation p′=A p with p=(x,y)T and A denoting a non-singular 2×2 matrix it can be shown that the Hessian matrix \({\mathcal{H}} f\) transforms in a similar way \(({\mathcal{H}} f')(p') = A^{-T} \, ({\mathcal{H}} f)(p) \, A^{-1}\) as the second-moment matrix μ′(p)=A −T μ(p) A −1 [31, 46] and (ii) provided that the Hessian matrix is either positive or negative definite, the Hessian matrix \({\mathcal{H}} L\) computed at a point p 0 defines an either positive or negative definite quadratic form \(Q_{{\mathcal{H}} L}(p) = (p - p_{0})^{T} ({\mathcal{H}} L) (p - p_{0})\) in a similar way as the second-moment matrix μ computed at p 0 does: Q μ(p)=(p−p 0)T μ (p−p 0). From these two analogies, we can conclude that provided the Hessian matrix is either positive or negative definite, these two types of descriptors should have strong qualitative similarities. Experimentally, the new differential interest point detectors \({\mathcal{D}}_{1}\), \(\tilde{\mathcal{D}}_{1}\), \({\mathcal{D}}_{2}\) and \(\tilde{\mathcal{D}}_{2}\) can be shown to perform very well and to allow for image features with better repeatability properties under affine and perspective transformations than the more traditional Laplacian or Harris operators [39].
The Laplacian ∇2 L responds to bright and dark blobs as formalized in terms of local minima or maxima of the Laplacian operator. The determinant of the Hessian \(\det {\mathcal{H}} L\) responds to bright and dark blobs by positive responses and in addition to saddle-like image features by negative responses as well as to corners. The unsigned Hessian feature strength \({\mathcal{D}}_{1} L\) responds to bright and dark blobs as well as to corners, with the complementary requirement that the ratio of the eigenvalues λ 1 and λ 2 of the Hessian matrix (with |λ 1|≤|λ 2) should be sufficiently close to one, as specified by the parameter k according to:
For this entity to respond, it is therefore necessary that there are strong intensity variations along two different directions in the image domain. The signed Hessian feature strength measure \(\tilde{\mathcal{D}}_{1} L\) responds to similar image features as the unsigned entity \({\mathcal{D}}_{1} L\), and in addition to saddle-like image features with a corresponding constraint on the ratio between the eigenvalues. The Hessian feature strength measures \({\mathcal{D}}_{2} L\) and \(\tilde{\mathcal{D}}_{2} L\) respond strongly when both of the principal curvatures are strong and the local image pattern therefore contains strong intensity variations in two orthogonal directions. The unsigned entity \({\mathcal{D}}_{2} L\) disregards the sign of the principal curvatures, whereas the signed entity \(\tilde{\mathcal{D}}_{2} L\) preserves the sign of the principal curvature of the lowest magnitude.
Other ways of defining image features from the second-order differential image structure of images have been proposed by Danielsson et al. [7] and Griffin [13].
2.3 Scale Selection Mechanisms
Scale Selection from γ-Normalized Derivatives
In (Lindeberg [29, 31, 35, 37]) a general framework for automatic scale selection was proposed based on the idea of detecting local extrema over scale of γ-normalized derivatives defined according to
where γ>0 is a free parameterFootnote 1 that can be related to the dimensionality of the image features that the feature detector is designed to respond to, e.g., in terms of the evolution properties over scale in terms of (i) self-similar L p-norms of Gaussian derivative operators for different dimensionalities of the image space [35, Sect. 9.1], (ii) self-similar Fourier spectra [35, Sect. 9.2] or (iii) the fractal dimension of the image data [53]; see also Appendix A.3 for an explicit interpretation of the parameter γ in terms of the dimensionality D of second-order image features according to (213).
Specifically, it was shown in [35] that local extrema over scale of homogeneous polynomial differential invariants \({\mathcal{D}}_{\gamma-\mathit{norm}} L\) expressed in terms of γ-normalized Gaussian derivatives are transformed in a scale-covariant way:
If some scale-normalized differential invariant \({\mathcal{D}}_{\gamma-\mathit{norm}} L\) assumes a local extremum over scale at scale t 0 in scale-space, then under a uniform rescaling of the input pattern by a factor s there will be a local extremum over scale in the scale-space of the transformed signal at scale s 2 t 0.
Furthermore, by performing simultaneous scale selection and spatial selection by detecting scale-space extrema, where the scale-normalized differential expression \({\mathcal{D}}_{\gamma-\mathit{norm}} L\) assumes local extrema with respect to both space and scale, constitutes a general framework for detecting scale-invariant interest points. Formally, such scale-space extrema are characterized by the first-order derivatives with respect to space and scale being zero
and in addition the composed Hessian matrix computed over both space and scale
being either positive or negative definite.
Generalized Scale Selection Mechanisms
In [39] this approach was extended in the following ways:
-
by performing post-smoothing of the differential expression \({\mathcal{D}}_{\gamma-\mathit{norm}} L\) prior to the detection of local extrema over space or scale
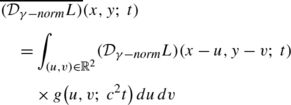 (18)
(18)with an integration scale (post-smoothing scale) t post=c 2 t proportional to the differentiation scale t with c>0 (see Appendix A.1 for a brief description of the algorithmic motivations for using such a post-smoothing operation when linking image features over scale that have been computed from non-linear differential entities) and
-
by performing weighted averaging of scale values along any feature trajectory T over scale in a scale-space primal sketch according to
$$ \hat{\tau}_T = \frac{\int_{\tau \in T} \tau \, \psi(({\mathcal{D}}_{\gamma-\mathit{norm}} L)(x(\tau);\; \tau)) \, d\tau}{ \int_{\tau \in T} \psi(({\mathcal{D}}_{\gamma-\mathit{norm}} L)(x(\tau);\; \tau)) \, d\tau} $$(19)where ψ denotes some (positive and monotonically increasing) transformation of the scale-normalized feature strength response \({\mathcal{D}}_{\gamma-\mathit{norm}} L\) and with the scale parameter parameterized in terms of effective scale [28]
$$ \tau = A \log t + B \quad \mbox{where }A \in \mathbb {R}_+\ \mbox{and}\ B \in \mathbb {R}$$(20)to obtain a scale covariant construction of the corresponding scale estimates
$$ \hat{t}_T = \exp \biggl( \frac{\hat{\tau}_T - B}{A} \biggr) $$(21)that implies that the resulting image features will be scale-invariant.

The motivation for performing scale selection by weighted averaging of scale-normalized differential responses over scale is analogous to the motivation for scale selection from local extrema over scale in the sense that interesting characteristic scale levels for further analysis should be obtained from the scales at which the differential operator assumes is strongest scale-normalized magnitude values over scale. Contrary to scale selection based on local extrema over scale, however, scale selection by weighted averaging over scale implies that the scale estimate will not only be obtained from the behaviour around the local extremum over scale, but also including the responses from all scales along a feature trajectory over scale. The intention behind this choice is that the scale estimates should therefore be more robust and less sensitive to local image perturbations.
Experimentally, it can be shown that scale-space interest points detected by these generalized scale selection mechanisms lead to interest points with better repeatability properties under affine and perspective image deformations compared to corresponding interest points detected by regular scale-space extrema [39]. In this sense, these generalized scale selection mechanisms make it possible to detect more robust image features. Specifically, the use of scale selection by weighted averaging over scale is made possible by linking image features over scale into feature trajectories,Footnote 2 which ensures that the scale estimates should only be influenced by responses from scale levels that correspond to qualitatively similar types of image structures along a feature trajectory over scale.
The subject of this article is to analyze properties of these generalized scale selection mechanisms theoretically when applied to the interest point detectors listed in Sect. 2.2.
3 Scale Selection Properties for Local Extrema over Scale
For theoretical analysis, we will consider a Gaussian prototype model of blob-like image structures. With such a prototype model, the semi-group property of the Gaussian kernel makes it possible to directly obtain the scale-space representations at coarser scales in terms of Gaussian functions, which simplifies theoretical analysis. Specifically, the result of computing polynomial differential invariants at different scales will be expressed in terms of Gaussian functions multiplied by polynomials. Thereby, closed-form theoretical analysis becomes tractable, which would otherwise be much harder to carry out regarding the application of the non-linear operations that are used for defining the interest points to general image data.
The use of Gaussian prototype model can also be motivated by conceptual simplicity. If we would like to model an image feature at some scale, then the Gaussian model is the model that requires the minimum amount of information in the sense that the Gaussian distribution is the distribution with maximum entropy Footnote 3 given a specification of the mean value m and the covariance matrix Σ of the distribution. Specifically, the Gaussian function with scale parameter t serves as an aperture function that measures image structures with respect to an inner scale beyond which finer-scale structures cannot be resolved.
In previous work [34, 35] it has been shown that determination of the γ-parameter in scale selection for different types of feature detection tasks, such as blob detection, corner detection, edge detection and ridge detection, can be performed based on the behaviour of these feature detectors on Gaussian-based intensity profiles. As will be shown later, the theoretical results that will be derived based on Gaussian blob models will lead to theoretical predictions that agree with the relative repeatability properties of different types of interest point detectors under affine and perspective transformations. Formally, however, further application of these results will be based on an assumption that the scale selection behaviour can be calibrated based on the behaviour for Gaussian prototype models.
3.1 Regular Scale Selection from Local Extrema over Scale
Two basic questions in the relation to the different interest point detectors reviewed in Sect. 2.2 concern:
-
How will the selected scale levels be related between different interest point detectors?
-
How will the scale-normalized magnitude values be related between different interest point detectors that respond to similar image structures?
Ideally, we would like similar scale estimates to be obtained for different interest point detectors, so that the interest point detectors could be modularly replaceable in the computer vision algorithms they are part of. Since the interest point detectors are expressed in terms of different types of linear or non-linear combinations of scale-space derivatives, a basic question concerns how to express comparable thresholds on the magnitude values for the different interest point detectors. In this section, we will relate these entities by applying scale selection from local extrema of scale-normalized derivatives over scale to a single Gaussian blob:
Due to the semi-group property of the Gaussian kernel
the scale-space representation of f obtained by Gaussian smoothing is given by
3.1.1 The Pure Second-Order Interest Point Detectors
By differentiation, if follows that the scale normalized (signed or unsigned) feature strength measure at the center (x,y)=(0,0) of the blob will for the Laplacian (5), the determinant of the Hessian (6) and the Hessian feature strength measures I (8) and II (10) be given by


By differentiating these expressions with respect to the scale parameter t and setting the derivative to zero, it follows that the extremum value over scale will for all these descriptors be assumed at the same scale
For the specific choice of γ=1, the selected scale \(\hat{t}\) will be equal to the scale of the Gaussian blob, i.e. \(\hat{t} = t_{0}\), and the extremum value over scale for each one of the respective feature detectors is


These results are in full agreement with earlier results about the scale selection properties for Gaussian blobs concerning the scale-normalized Laplacian and the scale-normalized determinant of the Hessian [31, Sect. 13.3.1] [35, Sect. 5.1].
3.1.2 Scale Invariant Feature Responses After Contrast Normalization
When applying different types of interest point detectors in parallel, some approach is needed for expressing comparable thresholds between different types of interest point detectors. Let us assume that such calibration of corresponding thresholds between different interest point detectors can be performed based on the their responses to Gaussian blobs. If we would like to present a Gaussian blob on a screen and would like to make it possible to vary its size (spatial extent) without affecting its perceived brightness on the screen, let us assume that this can be performed by keeping the contrast between the maximum and the minimum values constant. Let us therefore multiply the amplitude of the original Gaussian blob f by a factor 2πt 0 so as to obtain an input signal with unit contrast as measured by the range between the minimum and maximum values. Then, the maximum value over scale of the contrast normalized Gaussian blob will be given by


These expressions provide a way to express mutually related magnitude thresholds for the different interest point detectors as shown in Table 1.
Note:
For the Harris operator [16], which is determined from the second-moment matrix

according to
for some \(k \in ]0, \frac{1}{4}[\), a corresponding analysis shows that the response at the center (x,y)=(0,0) of a Gaussian blob is at scale t=t 0 given by
if we let the integration scale s be related to the local scale t according to s=r 2 t. This value therefore expresses the magnitude value that will obtained by applying the Harris-Laplace operator [49] to a Gaussian blob with unit contrast, provided that scale selection is performed using scale-normalized derivatives with γ=1. In all other respects, the scale selection properties of the Harris-Laplace operator are similar to the scale selection properties of the Laplacian operator.
3.1.3 The Rescaled Level Curve Curvature Operator
When applying the rescaled level curve curvature operator \(\tilde{\kappa}_{\gamma-\mathit{norm}}(L)\) to a rotationally symmetric Gaussian blob we obtain
This expression assumes its spatial extremum on the circle
where the extremum value is
and this entity assumes its extremum over scale at
In the special case when γ=7/8 [4] this corresponds to
with the corresponding scale-normalized response
and the following approximate relation for γ=7/8 if the Gaussian blob is normalized to unit contrast
Due to the use of a γ-value not equal to one, this magnitude measure is not fully scale invariant. The scale dependency can, however, be compensated for by multiplying the maximum feature response over scale by a scale-dependent compensation factor t 2(1−γ).
3.2 Scale Selection with Complementary Post-smoothing
When linking image features at different scales into feature trajectories, the use of post-smoothing of any differential expression \({\mathcal{D}}_{\mathit{norm}} L\) according to (18) was proposed in [39] to simplify the task for the scale linking algorithm, by suppressing small local perturbations in the responses of the differential feature detectors at any single scale. Since this complementary post-smoothing operation will affect the magnitude values of the scale-normalized differential responses that are used in the different interest point detectors, one may ask how large effect this operation will have on the resulting scale estimates.
In this section, we shall analyze the influence of the post-smoothing operation for scale selection based on local extrema over scale of scale-normalized derivatives.
3.2.1 The Laplacian and the Determinant of the Hessian Operators
Consider again a rotationally symmetric Gaussian blob (22) with its scale-space representation of the form (24). Then, the scale-normalized Laplacian \(\nabla^{2}_{\gamma-\mathit{norm}} L\) and the scale-normalized determinant of the Hessian \(\det {\mathcal{H}}_{\gamma-\mathit{norm}} L\) are given by


With complementary Gaussian post-smoothing with scale parameter t post=c 2 t, the resulting differential expressions assume the form


and assume their extremal scale-normalized responses over scale at


In the specific case when γ=1 and c=1/2, these local extrema over scale are given by


In other words, by comparison with the results in Sect. 3.1.1, we find that the use of a post-smoothing operation with integration scale determined by c=1/2, the scale estimates will be about 10 % lower when measured in units of \(\sigma = \sqrt{t}\).
To obtain unbiased scale estimates that lead to \(\hat{t} = t_{0}\) for a Gaussian blob, we can either multiply the scale estimates by correction factors from (52) and (53) or choose γ as function of c according to


With c=1/2, the latter settings correspond to the following values of γ:


3.2.2 The Hessian Feature Strength Measure I
To analyze the effect of the post-smoothing operation for the Hessian feature strength measure I computed for a Gaussian blob, which is given by

provided that this entity is positive, let us initially disregard the effect of the local condition \(\det {\mathcal{H}} L - k \operatorname {trace}^{2} {\mathcal{H}} L > 0\) in (8) and integrate the closed-form expression (60) over the entire image plane ℝ2 instead of over only the finite region where this entity is positive
Then, complementary post-smoothing with integration scale t post=c 2 t implies that this approximation of the post-smoothed differential entity is given by

Corresponding integration within the finite support region (61) where \({\mathcal{D}}_{1} > 0\) gives an expression that is too complex to be written out here.
Unfortunately, it is hard to analyze the scales at which these entities assumes local extrema over scale, since differentiation of the above mentioned expression and solving for its roots leads to fourth-order equations. In the case of γ=1, c=1/2 and κ=0.04, we can, however, find the numerical solution
For these parameter settings, the use of a spatial post-smoothing operation does again lead to scale estimates that are about 10 % lower.
If we restrict ourselves to the analysis of a single isolated Gaussian blob, a similar approximation holds for the signed Hessian feature strength measure \(\tilde{\mathcal{D}}_{1,\gamma-\mathit{norm}} L\).
3.2.3 The Hessian Feature Strength Measure II
For the Hessian feature strength measure II (10), we also have a corresponding situation with a logical switching between two differential entities |L pp| and |L qq| with L pp and L qq determined by (12) and (13). Solving for boundary between these domains, which is determined by L pp+L qq=0, gives that we should select |L qq| within the circular region
and |L pp| outside. Solving for the corresponding integrals gives


with
Unfortunately, it is again hard to solve for the local extrema over scale of the post-smoothed derivative expressions in closed form. For this reason, let us approximate the composed expression \(\overline{{\mathcal{D}}_{2} L}\) by the contribution from its first termFootnote 4 \(\overline{L_{qq}}_{\mathit{inside}}\) and with the integral extended from the circular region (64) to the entire image plane
Then, the local extrema over scale are given by the solutions of the third-order equation

where the special case with γ=1 and c=1/2 has the numerical solution
For the \({\mathcal{D}}_{2,\mathit{norm}} L\) operator and these parameter values, the use of a spatial post-smoothing operation does therefore lead to scale estimates that are about 16 % lower, and the influence is therefore stronger than for the Laplacian \(\nabla^{2}_{\mathit{norm}} L\), determinant of the Hessian \(\det {\mathcal{H}}_{\mathit{norm}} L\) or the Hessian feature strength \({\mathcal{D}}_{1,\mathit{norm}} L\) operators.
If we restrict ourselves to the analysis of a single isolated Gaussian blob, a similar approximation holds for the signed Hessian feature strength measure \(\tilde{\mathcal{D}}_{2,\gamma-\mathit{norm}} L\).
3.2.4 The Rescaled Level Curve Curvature Operator
If we apply post-smoothing to the rescaled level curve curvature computed for a rotationally symmetric Gaussian blob (41) with post-smoothing scale t post=c 2 t, we obtain

This entity assumes it spatial extremum on the circle
and the extremum value on this circle is

By differentiating this expression with respect to the scale parameter t, it follows that the selected scale level will be a solution of the third-order equation

Unfortunately, the closed form expression for the solution is rather complex. Nevertheless, we can note that due to the homogeneity of this equation, the solution will always be proportional the scale t 0 of the original Gaussian blob. In the specific case with γ=7/8 and c=1/2 we obtain
In other words, compared to the case without post-smoothing (45), the relative difference between the selected scale levels is here less than 5 %, when measured in units of \(\sigma = \sqrt{t}\).
3.3 Influence of Affine Image Deformations
To analyze the behaviour of the different interest point detectors under image deformations, let us next consider an anisotropic Gaussian blob as a prototype model of a rotationally symmetric Gaussian blob that has been subjected to an affine image deformation that we can see as representing a local linearization of the perspective mapping from a surface patch in the world to the image plane. Specifically, we can model the effect of foreshortening by different spatial extents t 1 and t 2 along the different coordinate directions
where the ratio between the scale parameter t 1 and t 2 is related to the angle θ between the normal directions of the surface patch and the image plane according to
if we without loss off generality assume that t 1≥t 2. Since all the feature detectors we consider are based on rotationally invariant differential expressions, it is sufficient to study the case when the anisotropic Gaussian blob is aligned to one the coordinate directions. Due to the semi-group property of the (one-dimensional) Gaussian kernel, the scale-space representation of f is then given by

Note on Relation to Influence Under General Affine Transformations
A general argument for studying the influence of non-uniform scaling transformations can be obtained by decomposing a general two-dimensional affine transformation matrix A into [32]
where R 1 and R 2 can be forced to be rotation matrices, if we relax the requirement of non-negative entries in the diagonal elements σ 1 and σ 2 of a regular singular value decomposition. With this model, the geometric average of the absolute values of the diagonal entries
corresponds to a uniform scaling transformation. We know that the Gaussian scale-space is closed under uniform scaling transformations, rotations and reflections.
The differential expressions we use for detecting interest points are based on rotationally invariant differential invariants, which implies that the scale estimates will also be rotationally invariant. Furthermore, our scale estimates are transformed in a scale covariant way under uniform scaling transformations. Hence, if we without essential loss of generality disregard reflections and assume that σ 1 and σ 2 are both positive, the degree of freedom that remains to be studied concerns non-uniform scaling transformations of the form

whose influence on the scale estimates will be investigated in this section.
3.3.1 The Laplacian operator
For the Laplacian operator, the γ-normalized response as function of space and scale is given by

This entity has critical points at the origin (x,y)=(0,0) and at


where the first pair of roots corresponds to saddle points if t 1>t 2, while the other pair of roots correspond to local extrema. Unfortunately, the critical points outside the origin lead to rather complex expressions. We shall therefore focus on the critical point at the origin, for which the selected scale(s) will be the root(s) of the third-order equation

For a general value of γ, the explicit solution is too complex to be written out here. In the specific case of γ=1, however, we obtain for t 1≥t 2

where


which in the special case of t 1=t 2=t 0 reduces to
If we on the other hand reparameterize the scale parameters t 1 and t 2 of the Gaussian blob as t 1=s t 0 and t 2=t 0/s, corresponding to a non-uniform scaling transformation with relative scaling factor s>1 renormalized such the determinant of the transformation matrix is equal to one, then a Taylor expansion of \(t_{\nabla^{2} L}\) around s=1 gives

From this result we get an approximate expression for how the Laplacian scale selection method is affected by affine transformations outside the similarity group. Specifically, we can note that the scales selected from local extrema over scale of the scale-normalized Laplacian operator are not invariant under general affine transformations.
3.3.2 The Determinant of the Hessian
By differentiation of (78) it follows that the scale-normalized determinant of the Hessian is given by

This expression does also have multiple critical points. Again, however, we focus on the central point (x,y)=(0,0), for which the derivative with respect to scale is of the form

This equation has a positive root at

which in the special case of γ=1 simplifies to the affine covariant expression
Notably, if we again reparameterize the scale parameters according to t 1=s t 0 and t 2=t 0/s, then for any non-uniform scaling transformation renormalized such that the determinant of the transformation matrix is one, it holds that
which implies that (in this specific case and with γ=1) scale selection based on the scale-normalized determinant of the Hessian leads to affine covariant scale estimates for the Gaussian blob model. In this respect, there is a significant difference to scale selection based on the scale-normalized Laplacian, for which the scale estimates will be biased according to (86) and (92).
For other values of γ, a Taylor expansion of \(t_{\det {\mathcal{H}} L}\) around s=1 gives

implying a certain dependency on the relative scaling factor s. Provided that |γ−1|<1/2, this dependency will, however, be lower than for the Laplacian scale selection method (92) with γ=1.
3.3.3 The Hessian Feature Strength Measure I
For the Hessian feature strength measure I, the behaviour of the scale-normalized response at the origin is given by

provided that this entity is positive. If we differentiate this expression with respect to the scale parameter and set the derivative to zero, we obtain a fourth-order equation, which in principle can be solved in closed form, but leads to very complex expressions, even when restricted to γ=1.
If we reparameterize the scale parameters according to t 1=s t 0 and t 2=t 0/s and then restrict the parameter k in \({\mathcal{D}}_{1,\gamma-\mathit{norm}}\) to k=0.04, however, we can obtain a manageable expression for the Taylor expansion of the selected scale \(t_{{\mathcal{D}}_{1}L}\) as function of the non-uniform scaling factor s in the specific case of γ=1

From this expression we can see that the scales selected from local extrema over scale of the scale-normalized Hessian feature strength measure I are not invariant under non-uniform scaling transformations. For values of s reasonably close to one, however, the deviation from affine invariance is quite low, and significantly smaller than for the Laplacian operator (92). This could also be expected, since a major contribution to the Hessian feature strength measure \({\mathcal{D}}_{1,\gamma-\mathit{norm}}\) originates from the affine covariant determinant of the Hessian \(\det {\mathcal{H}}_{\gamma-\mathit{norm}} L\).
3.3.4 The Hessian Feature Strength Measure II
With t 1>t 2, the Hessian feature strength measure II at the origin is given by

This entity assumes its local extremum over scale at

which in the case when γ=1 reduces to
If we again reparameterize the scale parameters according to t 1=s t 0 and t 2=t 0/s and in order to obtain more compact expressions restrict ourselves to the case when γ=1, then a Taylor expansion of \(t_{{\mathcal{D}}_{2} L}\) around s=1 gives

From a comparison with (92), (97) and (100) we can see that the scales selected from the scale-normalized Hessian feature strength measure II are more sensitive to non-uniform scaling transformations than the scales selected by the scale-normalized Laplacian \(\nabla_{\mathit{norm}}^{2} L\), the determinant of the Hessian \(\det {\mathcal{H}}_{\mathit{norm}} L\) or the Hessian feature strength measure \({\mathcal{D}}_{1,\mathit{norm}}\).
3.3.5 The Rescaled Level Curve Curvature Operator
For the anisotropic Gaussian blob model, a computation of the rescaled level curve curvature operator κ γ−norm(L) gives

This entity assumes its spatial maximum on the ellipse
and on this ellipse it holds that
By differentiating this expression with respect to t and setting the derivative to zero, it follows that the extremum over scale is assumed at

which in the special case when γ=5/4 reduces to the affine covariant expression
By again reparameterizing the scale parameters in the Gaussian blob model according to t 1=s t 0 and t 2=t 0/s and performing a Taylor expansion around s=1 for a general value of γ, it follows that

which in the case with γ=7/8 assumes the form

with second- and third-order relative bias terms about three times the magnitude compared to the Hessian feature strength measure I in (100).
4 Scale Selection by Weighted Averaging Along Feature Trajectories
The treatment so far has been concerned with scale selection based on local extrema over scale of scale-normalized derivatives. Concerning the new scale selection method based on weighted averaging over scale of scale-normalized derivative responses, an important question concerns how the scale estimates from this new scale selection method are related to the scale estimates from the previously established scale selection based on local extrema over scale. In this section, we will present a corresponding theoretical analysis of weighted scale selection concerning the basic questions:
-
How are the scale estimates related between the different interest point detectors? (Sect. 4.1)
-
How much does the post-smoothing operation influence the scale estimates? (Sect. 4.2 )
-
How are the scale estimates influenced by affine image deformations? (Sect. 4.3)
Given that image features x(t) at different scales t have been linked into a feature trajectory T over scale
scale selection by weighted averaging over scale implies that the scale estimate is computed as [39]

for some positive and monotonically increasing transformation function ψ of the magnitude values \(|({\mathcal{D}}_{\gamma-\mathit{norm}} L)(x(\tau);\; \tau)|\) of the differential feature responses. Specifically, the following family of scale invariant transformation functions was considered
where \(w_{{\mathcal{D}} L} \in [0, 1]\) is a so-called feature weighting function that measures the relative strength of the feature detector \({\mathcal{D}} L\) compared to other possible competing types of feature detectors and a is the scalar parameter in the self-similar power law.
In this section, we shall analyze the scale selection properties of this construction for the differential feature detectors defined in Sect. 2.2 under the simplifying assumptions of \(w_{{\mathcal{D}} L} = 1\) and a=1. With respect to the analysis at the center of a Gaussian blob, the assumption of \(w_{{\mathcal{D}} L} = 1\) is particularly relevant for the weighting functions of the form
considered in [39] if we make use of the fact that L ξ=L η=0 at any critical point (as at the center of a Gaussian blob) and disregard the influence of the noise suppression parameter ε.
4.1 The Pure Second-Order Interest Point Detectors
From the explicit expression for the magnitude of the scale-normalized Laplacian response at the center of rotationally symmetric Gaussian blob (25) it follows that the weighted scale selection estimate according to (113) will in the case of γ=1Footnote 5 and with the effective scale parameter τ defined as τ=logt be given by
Similarly, from the explicit expression for the determinant of the Hessian at the center of the Gaussian blob (26), it follows that the weighted scale estimate will be determined by
Due to the similarity between the explicit expressions for the Hessian feature strength measure I (27) and the determinant of the Hessian response (26) as well as the similarity between the Hessian feature strength measure II (28) and the Laplacian response (27) at the center of a Gaussian blob, the scale estimates for \({\mathcal{D}}_{1,\gamma-\mathit{norm}} L\) and \({\mathcal{D}}_{2,\gamma-\mathit{norm}} L\) will be analogous:


When expressed in terms of the regular scale parameter
the weighted scale selection method does hence for a rotationally symmetric Gaussian blob lead to similar scale estimates as are obtained from local extrema over scale of γ-normalized derivatives (29) when γ=1.
Since these scale estimates are similar to the scale estimates obtained form local extrema over scale, it follows that the scale-normalized magnitude values will also be similar and the relationships between scale-normalized thresholds described in Table 1 will also hold for scale selection based on weighted averaging over scale.
Corresponding Scale Estimates for General Values of γ
For a general value of γ∈]0,2[, the corresponding scale estimates become as follows in terms of effective scale τ=logt:


where both expressions have the limit value logt 0 when γ→1. (Note that |cot(πγ)|→∞ when γ→1.)
By comparing these scale estimates to the corresponding scale estimate \(\hat{\tau} = \log \frac{\gamma}{2-\gamma}\) in (29) obtained from local extrema over scale, we can compute a Taylor expansions of the difference in the scale estimates:


Notably, the difference in scale estimates between the two types of scale selection approaches is smallerFootnote 6 for scale selection using the determinant of the Hessian \(\det {\mathcal{H}} L\) or the Hessian feature strength measure \({\mathcal{D}}_{1,\mathit{norm}} L\) compared to scale selection based on the Laplacian \(\nabla_{\mathit{norm}}^{2} L\) or the Hessian feature strength measure \({\mathcal{D}}_{2,\mathit{norm}} L\).
4.2 Influence of the Post-smoothing Operation
4.2.1 The Laplacian and the Determinant of the Hessian Operators
From the explicit expressions for the post-smoothed Laplacian (50) and the post-smoothed determinant of the Hessian (51), it follows that the weighted scale estimates are for γ=1 given by


which agree with the corresponding scale estimates (52) and (53) for local extrema over scale of post-smoothed γ-normalized derivative expressions.
In the specific case when c=1/2 these scale estimates reduce to


again agreeing with our previous results (54) and (55) regarding scale selection based on local extrema over scale of post-smoothed scale-normalized derivative expressions.
4.2.2 The Hessian Feature Strength Measure I
To analyze the effect of weighted scale selection for the Hessian feature strength measure I, corresponding weighted integration over scale of the approximation (62) of the post-smoothed differential entity \(\overline{{\mathcal{D}}_{1} L}\) for γ=1 gives
where
and


In the specific case of c=1/2 and κ=0.04, this scale estimate is given by
in agreement with our previous result (63) regarding scale selection based on local extrema over scale of post-smoothed scale-normalized derivative expressions.
4.2.3 The Hessian Feature Strength Measure II
To analyze the effect of post-smoothing of the Hessian feature strength measure II in (10), let us again approximate the composed post-smoothed differential expression in (67) by the contribution from its first term (68) with the spatial integration extended to the entire plane. Then, the weighted scale estimate can be approximated by
where
In the specific case when c=1/2 this scale estimate reduces to
in agreement with our previous result (70) regarding scale selection based on local extrema over scale of post-smoothed scale-normalized derivative expressions.
4.3 Influence of Affine Image Deformations
To analyze how the scale estimates \(\hat{t}\) obtained by weighted averaging along feature trajectories are affected by affine image deformations, let us again consider an anisotropic Gaussian blob (76) as a prototype model of a rotationally symmetric Gaussian blob that has been subjected to an affine image deformation and with its scale-space representation according to (78).
4.3.1 The Laplacian Operator
At the origin, the scale-normalized Laplacian response according to (82) reduces to
and the scale estimate obtained by weighted scale selection is given by

With a reparameterization of the scale parameters t 1 and t 2 of the Gaussian blob as t 1=s t 0 and t 2=t 0/s, corresponding to a non-uniform scaling transformation with relative scaling factor s>1 renormalized such the determinant of the transformation matrix is equal to one, the scale estimate in units of t can be written

Notably, this scale estimate is not identical to the scale estimate (86) obtained from local extrema over scale. The Taylor expansion of \(t_{\nabla^{2} L}\) around s=1 is in turn given by

and is, however, similar until the third-order terms to the Taylor expansion (92) of the corresponding scale estimate obtained from local extrema over scale. In this respect, the behaviour of the two scale selection methods is qualitatively rather similar when applied to the anisotropic Gaussian blob model.
4.3.2 The Determinant of the Hessian
At the origin, the response of the determinant of the Hessian operator (93) simplifies to
and the scale estimate obtained by weighted scale selection is

corresponding to the affine covariant scale estimate
and in agreement with our earlier result (96) for scale selection from local extrema over scale.
4.3.3 The Hessian Feature Strength Measure I
With the Hessian feature strength measure I at the origin given by (99), the scale estimate obtained by weighted scale selection is determined by
where

With a reparameterization of the scale parameters according to t 1=s t 0 and t 2=t 0/s, this expression simplifies to
with


A Taylor expansion around s=1 of the scale estimate expressed in units of t=expt gives

which simplifies to the following form for κ=0.04

and agreeing until the third-order terms with the corresponding Taylor expansion (100) for the scale estimate obtained from local extrema over scale.
Specifically, a comparison with the corresponding expression for the Laplacian operator (140) shows that scale selection based on the Hessian feature strength measure I is less sensitive to affine image deformations compared to scale selection based on the Laplacian.
4.3.4 The Hessian Feature Strength Measure II
Assuming that t 1≥t 2, the Hessian feature strength measure II at the origin is given by
and the weighted scale estimate

With the scale parameters reparameterized according to t 1=s t 0 and t 2=t 0/s, the corresponding scale estimate can be written

for which a Taylor expansion around s=1 gives

and agreeing until the second-order terms with the corresponding Taylor expansion (104) for the scale estimate obtained from local extrema over scale.
Again, the scale estimates for scale selection based on the Hessian feature strength measure II are more affected by affine image deformations compared to the scale estimates obtained by the determinant of the Hessian, the Hessian feature strength measure I or the Laplacian.
5 Relations Between the Scale Selection Methods
5.1 Rotationally Symmetric Gaussian Blob
From the above mentioned results, we can first note that for the specific case of a rotationally symmetric Gaussian blob, the scale estimates obtained from local extrema over scale vs. weighted averaging over scale are very similar.
Table 2 shows the scales that are selected for the Laplacian \(\nabla^{2}_{\mathit{norm}} L\) and the determinant of the Hessian \(\det {\mathcal{H}}_{\mathit{norm}} L\) in the presence of a general post-smoothing operation. Table 3 shows corresponding approximate estimates for the Hessian feature strength measure \({\mathcal{D}}_{1,\mathit{norm}} L\) and the Hessian feature strength measure \({\mathcal{D}}_{2,\mathit{norm}} L\) for c=1/2. Notably, the exact scale estimates agree perfectly, whereas the approximate estimates are very similar. In this sense, the two scale selection methods have rather similar effects when applied to a rotationally symmetric Gaussian blob.
5.1.1 Theoretical Symmetry Properties Between the Scale Estimates
The similarity between the results of the two scale selection methods can generally be understood by studying the scale-space signatures that show how the Laplacian and the determinant of the Hessian responses evolve as function of scale at the center of the blob (below assuming no post-smoothing corresponding to c=0):


The left column in the upper and middle rows in Fig. 3 shows these graphs with a linear scaling of the regular scale parameter t and the right column shows corresponding graphs with a logarithmic scaling of the scale parameter in terms of effective scale τ.

Scale-space signatures computed from a Gaussian blob with scale parameter t 0=10 for (top row) the Laplacian \(\nabla^{2}_{\mathit{norm}} L\) for γ=1, (middle row) the determinant of the Hessian \(\det {\mathcal{H}}_{\mathit{norm}} L\) for γ=1 and (bottom row) the second-order derivative L ξξ for a 1-D signal and γ=3/4 so as to give rise to the peak over scale at \(\hat{t} = t_{0}\) using (left column) a linear scaling of the scale parameter t or (right column) a logarithmic transformation in terms of effective scale τ=logt
As can be seen from the latter graphs, the scale-space signatures assume a symmetric shape when expressed in terms of effective scale, which implies that the weighted scale estimates, which correspond to the center of gravity of the graphs, will be assumed at a similar position as the global extremum over scale. This property can also be understood algebraically, due to the functional symmetry of (154) and (155) under mappings of the form
corresponding to the symmetry
Since the response properties of the Hessian feature strength measures \({\mathcal{D}}_{1,\mathit{norm}} L\) and \({\mathcal{D}}_{2,\mathit{norm}} L\) are of similar forms


corresponding symmetry properties follow also for these operators. These symmetry properties do also extend to monotonically increasing transformations ψ of the differential responses of the form


These symmetry properties do, however, not extend to general values of γ≠1, since such values may lead to a skewness in the scale-space signature (see the bottom row in Fig. 3).
5.1.2 Calibration Factors for Setting Scale-Invariant Integration Scales
The scale estimates may, however, differ depending on what differential expression the interest point detector is based on. Hence, if we would like to set an integration scale t int for computing a local image descriptor from the scale estimate \(\hat{t}_{{\mathcal{D}} L}\), in such a way that the integration scale should be the same
for any interest point detector \({\mathcal{D}} L\) applied to a rotationally symmetric Gaussian blob, irrespective of whether the interest points are computed from scale-space extrema or feature trajectories in a scale-space primal sketch, we can parameterize the integration scale according to
with the calibration factor \(A_{{\mathcal{D}} L}\) determined from the results in Table 4.
5.2 Anisotropic Gaussian Blob
5.2.1 Taylor Expansions for Non-uniform Scaling Factors Near s=1
From the analysis of the scale selection properties of an anisotropic Gaussian blob with scale parameters t 1 and t 2 in Sect. 3.3 and Sect. 4.2, we found that scale selection based on local extrema over scale or weighted scale selection lead to a similar and affine covariant scale estimate \(\sqrt{t_{1} t_{2}}\) for the determinant of the Hessian operator \(\det {\mathcal{H}}_{\mathit{norm}} L\).
For the Laplacian \(\nabla_{\mathit{norm}}^{2} L\) and the Hessian feature strength measures \({\mathcal{D}}_{1,\mathit{norm}} L\) and \({\mathcal{D}}_{2,\mathit{norm}} L\), the scale estimates are, however, not affine covariant. Moreover, the two scale selection methods may lead to different results. When performing a Taylor expansion of the scale estimate parameterized in terms of a non-uniform scaling factor s relative to a base-line scale t 0, the Taylor expansions around s=1 did, however, agree in their lowest order terms. In this sense, the two scale selection approaches have approximately similar properties for the Gaussian blob model for affine image deformations near the similarity group.
From a comparison between the Taylor expansions for the scale estimates for the different interest point detectors in Table 5, we can conclude that after the affine covariant determinant of the Hessian \(\det {\mathcal{H}}_{\mathit{norm}} L\), the scale estimate obtained from Hessian feature strength measure \({\mathcal{D}}_{1,\mathit{norm}} L\) has the lowest sensitive to affine image deformations followed by the Laplacian \(\nabla_{\mathit{norm}}^{2} L\) and the Hessian feature strength measure \({\mathcal{D}}_{2,\mathit{norm}} L\). Corresponding results hold for the corresponding signed Hessian feature strength measures \(\tilde{\mathcal{D}}_{1,\mathit{norm}} L\) and \(\tilde{\mathcal{D}}_{2,\mathit{norm}} L\).
5.2.2 Graphs of Non-uniform Scaling Dependencies for General s≥1
From the analysis in Sect. 4.3 it follows from (139), (142), (144) and (152) that for an anisotropic Gaussian blob with scale parameters t 1=s t 0 and t 2=t 0/s, the scale estimates for weighted scale selection using the Laplacian \(\nabla_{\mathit{norm}}^{2} L\), determinant of the Hessian \(\det {\mathcal{H}}_{\mathit{norm}} L\) and the Hessian feature strength measures \({\mathcal{D}}_{1,\mathit{norm}} L\) and \({\mathcal{D}}_{2,\mathit{norm}} L\) are in the absence of post-smoothing (c=0) given by


Figure 4 shows graphs of how the scale estimates depend on the non-uniform scaling parameter s for scale selection by weighted averaging over scale. As can be seen from these graphs, the behaviour is qualitatively somewhat different for the four differential expressions.

Dependency of the scale estimates \(\hat{t}_{{\mathcal{D}} L}\) on the amount of non-uniform scaling s∈[1,4] when performing scale selection by weighted averaging over scale for a non-uniform Gaussian blob with scale parameters t 1=s t 0 and t 2=t 0/s for (upper left) the Laplacian \(\nabla^{2}_{\mathit{norm}} L\), (upper right) the determinant of the Hessian \(\det {\mathcal{H}}_{\mathit{norm}} L\), (lower left) the Hessian feature strength I \({\mathcal{D}}_{1,\mathit{norm}} L\) and (lower right) the Hessian feature strength I \({\mathcal{D}}_{2,\mathit{norm}} L\). (Horizontal axis: Non-uniform scaling factor s. Vertical axis: Scale estimate \(\hat{t}_{{\mathcal{D}} L}\) in units of t 0)
For the determinant of the Hessian \(\det {\mathcal{H}}_{\mathit{norm}} L\), the scale estimate coincides with the geometric average of the scale parameters for any non-singular amount of non-uniform scaling. For the Laplacian operator \(\nabla_{\mathit{norm}}^{2} L\), the scale estimate \(\hat{t}_{\nabla^{2} L}\) is lower than the geometric average of the scale parameters in the two directions, whereas the scale estimates are higher than the geometric average for the Hessian feature strength measures \({\mathcal{D}}_{1,\mathit{norm}} L\) and \({\mathcal{D}}_{2,\mathit{norm}} L\). For moderate values of s∈[1,4], the scale estimates from the Hessian feature strength measure \({\mathcal{D}}_{1,\mathit{norm}} L\), are quite close to the affine covariant geometric average. For the Hessian feature strength measure \({\mathcal{D}}_{2,\mathit{norm}} L\) on the other hand, the scale estimate increases approximately linearly with the non-uniform scaling factor s.
These graphs also show that the qualitative behaviour derived for Taylor expansions near s=1 (Table 5) extend to non-infinitesimal scaling factors up to at least a factor of four.
5.3 Comparison with Experimental Repeatability Properties
In this section, we shall compare the above mentioned theoretical results with experimental results of the repeatability properties of the different interest point detectors under affine image transformations.
5.3.1 Experimental Methodology
Figure 5 shows a few examples of images from an image data set with 14 images from natural environments. Each such image was subjected to 10 different types of affine image transformations encompassing:
-
a pure scaling U(s) with scaling factor s=2,
-
a pure rotation R(φ) with rotation angle φ=π/4, and
-
non-uniform scalings N(s) with scaling factors \(s = \sqrt[4]{2}\) and \(s = \sqrt{2}\), respectively, which are repeated and averaged over four different orientations respectively
$$ N_{\varphi_0}(s) = R(\varphi_0) \, N(s) \, R( \varphi_0)^{-1} $$(168)with relative orientations of φ 0=0, π/4, π/2 and 3π/4.
For a locally planar surface patch viewed by a scaled orthographic projection model, the non-uniform rescalings correspond to the amount of foreshortening that arises with slant angles equal to 32.8∘ and 45∘, respectively. In this respect, the chosen deformations reflect reasonable requirements of robustness to viewing variations for image-based matching and recognition.

Sample images from a dataset with 14 images used for experiments with repeatability properties under affine image deformations. (Image size: 560×420 pixels)
For each one of the resulting 14×(1+10)=154 images, the 400 most significant interest points were detected. For interest points detected based on scale-space extrema, the image features were ranked on the scale-normalized response of the differential operator at the scale-space extremum. For interest points detected by scale linking, the image features were ranked on a significance measure obtained by integrating the scale-normalized responses of the differential operator along each feature trajectory, using the methodology described in [39].
To make a judgement of whether two image features A and B′ detected in two differently transformed images f and f′ should be regarded as belonging to the same feature or not, we associated a scale dependent circle C A and C B′ with each feature, with the radius of each circle equal to the detection scale of the corresponding feature measured in units of the standard deviation \(\sigma = \sqrt{t}\) of the Gaussian kernel used for scale-space smoothing to the selected scale, in a similar way as the graphical illustrations of scale dependent image features in previous sections. Then, each such feature was transformed to the other image domain, using the affine transformation applied to the image coordinates of the center of the circle and with the scale value transformed to be proportional to the determinant of the affine transformation matrix, t′=(detA) t, resulting in two new circular features C A′ and C B. The relative amount of overlap between any pair of circles was defined by forming the ratio between the intersection and the union of the two circles in a similar way as [50] define a corresponding ratio for ellipses
Matching relations were computed in both directions and a match was then permitted only if a pair of image features maximize this ratio over replacements of either image feature by other image features in the same domain and, in addition, the value of this ratio was above a threshold m(C A,C B)>m 0, where we have chosen m 0=0.40. Furthermore, only one match was permitted for each image feature, and matching candidates were evaluated in decreasing order of significance.
Finally, given that a total number of N matched features matches have been found from N features detected from the image f and N′ features from the transformed image f′, the matching performance was computed as
The matching performance was computed in both directions from f to f′ as well as from f′ to f and the average value of these performance measures was reported.
The evaluation of the matching score was only performed for image features that are within the image domain for both images before and after the transformation. Moreover, only features within corresponding scale ranges were evaluated. In other words, if the scale range for the image f before the affine transformation was [t min,t max], then image features were searched for in the transformed image f′ within the scale range \([t'_{\mathit{min}}, t'_{\mathit{max}}] = [(\det A) \, t_{\mathit{min}}, (\det A) \, t_{\mathit{max}}]\). In addition, features in a narrow scale-dependent frame near the image boundaries were suppressed, to avoid boundary effects from influencing the results. In these experiments, we used t min=4 and t max=256.
5.3.2 Relations Between Experimental Results and Theoretical Results
Table 6 and Table 7 show the average repeatability scores obtained for the 7 different interest point detectors we have studied in this work. For the Laplacian ∇norm L, determinant of the Hessian \(\det {\mathcal{H}}_{\mathit{norm}} L\) and the Hessian feature strength measures \({\mathcal{D}}_{2,\mathit{norm}} L\) and \(\tilde{\mathcal{D}}_{2,\mathit{norm}} L\), we have also applied complementary thresholding on either \({\mathcal{D}}_{1,\mathit{norm}} L > 0\) or \(\tilde{\mathcal{D}}_{1,\mathit{norm}} L > 0\), which increases the robustness of the image features and improves the repeatability scores of the interest point detectors. For comparison, we do also show corresponding repeatability scores obtained with the Harris-Laplace operator. With these variations, a total number 10 differential interest point detectors are evaluated. Separate evaluations are also performed for scale selection from local extrema over scale vs. scale selection by scale linking and weighted averaging over scale.
As can be seen from Table 6, the best repeatability properties for the interest point detectors based on scale selection from local extrema over scale are obtained for (i) the rescaled level curve curvature \(\tilde{\kappa}_{\gamma-\mathit{norm}}(L)\), (ii) the Hessian feature strength measure \({\mathcal{D}}_{1,\mathit{norm}} L\) and (iii) the determinant of the Hessian \(\det {\mathcal{H}}_{\mathit{norm}} L\).
From Table 7, we can see that the best repeatability properties for the interest point detectors based on scale selection using scale linking and weighted averaging over scale are obtained for (i) the Hessian feature strength measure \({\mathcal{D}}_{1,\mathit{norm}} L\), (ii) the determinant of the Hessian \(\det {\mathcal{H}}_{\mathit{norm}} L\) and (iii) the Hessian feature strength measure \(\tilde{\mathcal{D}}_{2,\mathit{norm}} L\).
The repeatability scores are furthermore generally better for scale selection based on weighted averaging over scale compared to scale selection based on local extrema over scale.
In comparison with our theoretical analysis, we have previously shown that the response of the determinant of the Hessian \(\det {\mathcal{H}}_{\mathit{norm}} L\) to an affine Gaussian blob is affine covariant, for both scale selection based on local extrema over scale (97) and scale selection based on scale linking and weighted averaging over scale (143). For the Hessian feature strength measure \({\mathcal{D}}_{1,\mathit{norm}} L\), a major contribution to this differential expression comes from the affine covariant determinant of the Hessian \(\det {\mathcal{H}}_{\mathit{norm}} L\), and the deviations from affine covariance are small for both scale selection based on local extrema over scale (100) and scale selection by weighted averaging over scale (148), provided that the non-uniform image deformations are not too far from the similarity group in the sense that the non-uniform scaling factor s used in the Taylor expansions is not too far from 1. Specifically, the two interest point detectors that have the best theoretical properties under affine image deformations in the sense of having the smallest correction terms in Table 5 are also among the top three interest point detectors for both scale selection based on local extrema over scale and scale selection based on scale linking and weighted averaging over scale. In this respect, the predictions from our theoretical analysis are in very good agreement with the experimental results.
Somewhat more surprisingly the signed Hessian feature strength measure \(\tilde{\mathcal{D}}_{2,\mathit{norm}} L\) performs very well when combined with scale selection based on weighted averaging over scale. The corresponding unsigned entity \({\mathcal{D}}_{2,\mathit{norm}} L\) does not perform as well, and more comparable to the Laplacian operator \(\nabla_{\mathit{norm}}^{2} L\). A possible explanation for this is that keeping the signs of the principal curvatures in the non-linear minimum operation improves the ability of this operator to distinguish between nearby competing image structures, a property that is not captured by the analysis of isolated Gaussian blobs. The repeatability properties of the unsigned version \({\mathcal{D}}_{2,\mathit{norm}} L\) are therefore in closer agreement with the presented analysis.
The rescaled level curve curvature \(\tilde{\kappa}_{\gamma-\mathit{norm}}(L)\) performs comparably very well for scale selection based on local extrema over scale, whereas it does not perform as well for scale selection based on scale linking and weighted averaging over scale. For scale selection based on local extrema over scale, our analysis showed that the deviation from affine covariance is comparably low (111) for the value of γ=7/8 that we used in our experiments. For this scale selection method, the experimental results are therefore in agreement with our theoretical results. Contrary to the other interest point detectors, the repeatability properties of the rescaled level curve curvature operator \(\tilde{\kappa}_{\gamma-\mathit{norm}}(L)\) are, however, not improved by scale linking. A possible algorithmic explanation to this could be that the rescaled level curve curvature operator \(\tilde{\kappa}_{\gamma-\mathit{norm}}(L)\) contains a different type of non-linearity that may cause difficulties for the scale linking algorithm. Calculating closed-form expressions for the scale estimates obtained by weighed averaging over scale does also seem harder for this operator. We therefore leave it as an open problem to investigate if also this interest point detector could be improved by scale linking and scale selection from weighted averaging of possibly transformed magnitude values along the corresponding feature trajectories.
Experimental results in [39] show that the Hessian feature strength measure \({\mathcal{D}}_{1,\mathit{norm}} L\) and the determinant of the Hessian \(\det {\mathcal{H}}_{\mathit{norm}} L\) and are also the two interest point detectors that give the best repeatability properties under real (calibrated) perspective image transformations. Thus, the two best interest point detectors according to our theoretical analysis are also the interest point detectors that have the best properties for real image data.
6 Summary and Discussion
We have analyzed the scale selection properties of (i) the Laplacian operator \(\nabla_{\mathit{norm}}^{2} L\), (ii) the determinant of the Hessian \(\det {\mathcal{H}}_{\mathit{norm}} L\), (iii)–(iv) the new Hessian feature strength measures \({\mathcal{D}}_{1,\mathit{norm}} L\) and \({\mathcal{D}}_{2,\mathit{norm}} L\) and (iv) the rescaled level curve curvature operator \(\tilde{\kappa}_{\gamma-\mathit{norm}}(L)\) when applied to a Gaussian prototype blob model and using scale selection from either (vi) local extrema over scale of scale-normalized derivatives or (vii) weighted averaging of scale values along feature trajectories over scale. We have also analyzed (viii) the influence of a secondary post-smoothing step after the computation of possibly non-linear differential invariants and (ix) the sensitivity of the scale estimates to affine image deformations.
The analysis shows that the scale estimates from the determinant of the Hessian \(\det {\mathcal{H}}_{\mathit{norm}} L\) are affine covariant for the Gaussian blob model for both scale selection based on local extrema over scale and scale selection by weighted averaging over scale. The analysis also shows that the scale estimates from the Laplacian operator \(\nabla_{\mathit{norm}}^{2} L\) and the Hessian feature strength measures \({\mathcal{D}}_{1,\mathit{norm}} L\) and \({\mathcal{D}}_{2,\mathit{norm}} L\) are not affine covariant. Out of the latter three operators, the Hessian feature strength measure \({\mathcal{D}}_{1,\mathit{norm}} L\) has the lowest sensitivity to affine image deformations outside the similarity group, whereas the Hessian feature strength measure \({\mathcal{D}}_{2,\mathit{norm}} L\) has the highest sensitivity. The stronger scale dependency of the Hessian feature strength measure \({\mathcal{D}}_{2,\mathit{norm}} L\) can be understood from the fact that it responds to the eigenvalue of the Hessian matrix corresponding to the slowest spatial variations.
Experimental results reported in Sect. 5.3 and [39], show that the interest point detectors based on the new Hessian feature strength measure \({\mathcal{D}}_{1,\mathit{norm}} L\) and the determinant of the Hessian \(\det {\mathcal{H}}_{\mathit{norm}} L\) have significantly better repeatability properties under affine or perspective image transformations than the Laplacian ∇norm L or the Hessian feature strength measure \({\mathcal{D}}_{2,\mathit{norm}} L\). Corresponding advantages hold relative to the difference-of-Gaussians (DoG) approximation of the Laplacian operator or the Harris-Laplace operator. Hence, the interest point detectors that have the best theoretical properties under affine deformations of Gaussian blobs do also have the best experimental properties. In this respect, the predictions from this theoretical analysis agree with corresponding experimental results.
When considering scale selection for a rotationally symmetric Gaussian blob, it is shown that the scale estimates obtained by scale selection from local extrema over scale vs. weighted averaging over scale do for γ=1 (in the 2-D case) lead to similar results for each one of these four operators. This similarity can be explained from a symmetry property of the scale-space signature under inversion transformations of the scale parameter, which correspond to reflections along the scale axis after a logarithmic transformation of the scale parameter in terms of effective scale. Because of this similarity between the scale estimates obtained from the two types of scale selection approaches, we may conclude that no additional scale compensation or scale calibration is needed between scale estimates that are obtained from weighted averaging over scale vs. local extrema over scale (provided that γ=1).
Since the commonly used difference-of-Gaussians operator can be seen as a discrete approximation of the Laplacian operator [41], the analysis of the scale selection properties for the Laplacian operator also provides a theoretical model for analyzing the scale selection properties of the difference-of-Gaussian keypoint detector used in the SIFT operator [48]. The above mentioned results concerning the scale selection properties of the Laplacian operator \(\nabla^{2}_{\mathit{norm}} L\) do also extend to the Harris-Laplace operator [49] for which the spatial selection is performed based on spatial extrema of the Harris measure H, whereas the scale selection properties are solely determined by the scale selection properties of the Laplacian \(\nabla^{2}_{\mathit{norm}} L\). Incorporating the scale selection properties of the determinant of the Hessian \(\det {\mathcal{H}}_{\mathit{norm}} L\), the results do also extend to the Harris-detHessian, detmu-Laplace and detmu-detHessian operators proposed in [39] as well as other possible types of hybrid approaches.
For scale estimates that are computed algorithmically from real-world images in an actual implementation, the robustness of image features that are obtained by scale selection from local extrema over scale or weighted scale selection over scale may, however, differ substantially. Experimental results reported in Sect. 5.3 and [39] show that weighted scale selection leads to interest points that have significantly better repeatability properties under perspective image deformations compared to interest points computed with scale selection from local extrema over scale. Theoretically, we have also seen that in several cases, weighted scale selection makes it easier to derive closed-form expressions for the scale estimate than for scale selection based on local extrema over scale. In these respects, scale selection by weighted averaging over scale can have both practical and theoretical advantages.
When making use of a complementary post-smoothing operation to suppress spurious variations in the non-linear feature responses from the interest point detectors to simplify the task of scale linking, the influence of this post-smoothing operation on the scale estimates may, however, be different for different interest point detectors. If we assume that scale calibration can be performed based on the scale selection properties for Gaussian blobs, we have derived a set of relative calibration or compensation factors for each one of the five main types of interest point detectors studied in this paper.
To conclude, the analysis presented in this paper provides a theoretical basis for a defining a richer repertoire of mechanisms for computing scale-invariant image features and image descriptors for a wide range of possible applications in computer vision. In very recent work [42], these generalized scale-space interest points have been integrated with local scale-invariant image descriptors and been demonstrated to lead to highly competitive results for image-based matching and recognition.
As outlined in Appendix A.2, these interest point detectors and the analysis of these can be extended to higher-dimensional image data in a rather straightforward manner.
Notes
Indeed, it can be shown that the definition of scale-normalized derivatives in this way captures the full degrees of freedom by which scale invariance can be obtained from local extrema over scale of scale-normalized derivatives defined from a Gaussian scale-space, as formally proved by necessity in [35, Appendix A.1].
By linking image features over scale into feature trajectories it also becomes possible to define a significance value by integrating scale-normalized feature responses over scale. Experimentally, it can be shown that such ranking of image features leads to selections of subsets of interest points with better overall repeatability properties than selection of subsets of interest points from the extremum responses of interest points detectors at scale-space extrema. An intuitive motivation for this property is a heuristic principle that image features that are stable over large ranges of scales should be more likely to be significant than image features that only exist over a shorter life length in scale-space [27, Assumption 1 in Sect. 3 on p. 296].
This approximation may be reasonable for small values of c for which the major contribution of the post-smoothing integration originates from values of \({\mathcal{D}}_{2} L\) near the interest point.
In this section we will in many cases restrict the analysis to the specific case of γ=1, since some of the results become significantly more complex for a general value of γ≠1. In a few cases where the corresponding results become reasonably compact, we will, however, include them.
A plausible explanation why the difference between the scale estimated is smaller for the determinant of the Hessian \(\det {\mathcal{H}} L\) and the Hessian feature strength measure \({\mathcal{D}}_{1,\mathit{norm}} L\) compared to difference in scale estimates for the Laplacian \(\nabla_{\mathit{norm}}^{2} L\) and the Hessian feature strength measure \({\mathcal{D}}_{2,\mathit{norm}} L\) is that second-order derivative responses are squared for the determinant of the Hessian \(\det {\mathcal{H}} L\) and the Hessian feature strength measure \({\mathcal{D}}_{1,\mathit{norm}} L\), whereas the Laplacian \(\nabla_{\mathit{norm}}^{2} L\) and the Hessian feature strength measure \({\mathcal{D}}_{2,\mathit{norm}} L\) operators depend on the second-order derivative responses in a linear way.
Thereby, the integrals that define the weighted scale selection estimates will get a comparably higher relative contribution from scale levels near the maximum over scale, which in turn implies that the influence due to skewness in the scale-space signature caused by values of γ≠1 will be lower (compare with Sect. 5.1.1). By varying the power a in the self-similar transformation function (114), it is more generally possible to modulate this effect.
The motivation for multiplying the Gaussian curvature by a power of the gradient magnitude in (175) is that the resulting operator should assume high values when the gradient magnitude and the Gaussian curvature are simultaneously high. More generally, also other powers of the gradient magnitude could be considered (204). The current power of four is chosen because it leads to the simplest calculations, in analogy with the multiplication by the gradient magnitude raised to the power of three for the 2-D rescaled level curve curvature operator (7).
References
Baumberg, A.: Reliable feature matching across widely separated views. In: Proc. CVPR, Hilton Head, SC, pp. 1774–1781 (2000)
Bay, H., Ess, A., Tuytelaars, T., van Gool: Speeded up robust features (SURF). Comput. Vis. Image Underst. 110(3), 346–359 (2008)
Bevensee, R.: Maximum Entropy Solutions to Scientific Problems. Prentice Hall, New York (1993)
Bretzner, L., Lindeberg, T.: Feature tracking with automatic selection of spatial scales. Comput. Vis. Image Underst. 71(3), 385–392 (1998)
Chomat, O., de Verdiere, V., Hall, D., Crowley, J.: Local scale selection for Gaussian based description techniques. In: Proc. ECCV’00, Dublin, Ireland. Lecture Notes in Computer Science, vol. 1842, pp. 117–133. Springer, Berlin (2000)
Constable, R.T., Henkelman, R.M.: Why MEM does not work in MR image reconstruction. Magn. Reson. Med. 14(1), 12–25 (1990)
Danielsson, P.E., Lin, Q., Ye, Q.Z.: Efficient detection of second-degree variations in 2D and 3D images. J. Vis. Commun. Image Represent. 12(3), 255–305 (2001)
Donoho, D.L., Johnstone, I.M., Hoch, J., Stern, A.S.: Maximum entropy and the nearly black object. J. R. Stat. Soc., Ser. B (Methodological) 54, 41–81 (1992)
Elder, J., Zucker, S.: Local scale control for edge detection and blur estimation. IEEE Trans. Pattern Anal. Mach. Intell. 20(7), 699–716 (1998)
Florack, L.M.J.: Image Structure. Series in Mathematical Imaging and Vision. Springer, Berlin (1997)
Frangi, A.F., Niessen, W.J., Hoogeveen, R.M., vanWalsum, T., Viergever, M.A.: Model-based quantitation of 3D magnetic resonance angiographic images. IEEE Trans. Med. Imaging 18(10), 946–956 (1999)
Gårding, J., Lindeberg, T.: Direct computation of shape cues using scale-adapted spatial derivative operators. Int. J. Comput. Vis. 17(2), 163–191 (1996)
Griffin, L.D.: The second order local-image-structure solid. IEEE Trans. Pattern Anal. Mach. Intell. 29(8), 1355–1366 (2007)
ter Haar Romeny, B.: Front-End Vision and Multi-Scale Image Analysis. Springer, Berlin (2003)
Hall, D., de Verdiere, V., Crowley, J.: Object recognition using coloured receptive fields. In: Proc. ECCV’00, Dublin, Ireland. Lecture Notes in Computer Science, vol. 1842, pp. 164–177. Springer, Berlin (2000)
Harris, C., Stephens, M.: A combined corner and edge detector. In: Alvey Vision Conference, pp. 147–152 (1988)
Iijima, T.: Observation theory of two-dimensional visual patterns. Tech. rep., Papers of Technical Group on Automata and Automatic Control, IECE, Japan (1962)
Kadir, T., Brady, M.: Saliency, scale and image description. Int. J. Comput. Vis. 45(2), 83–105 (2001)
Kang, Y., Morooka, K., Nagahashi, H.: Scale invariant texture analysis using multi-scale local autocorrelation features. In: Proc. Scale Space and PDE Methods in Computer Vision (Scale-Space’05). Lecture Notes in Computer Science, vol. 3459, pp. 363–373. Springer, Berlin (2005)
Koenderink, J.J.: The structure of images. Biol. Cybern. 50, 363–370 (1984)
Koenderink, J.J., van Doorn, A.J.: Generic neighborhood operators. IEEE Trans. Pattern Anal. Mach. Intell. 14(6), 597–605 (1992)
Krissian, K., Malandain, G., Ayache, N., Vaillant, R., Trousset, Y.: Model-based detection of tubular structures in 3D images. Comput. Vis. Image Underst. 80(2), 130–171 (2000)
Laptev, I., Lindeberg, T.: Space-time interest points. In: Proc. 9th Int. Conf. on Computer Vision, Nice, France, pp. 432–439 (2003)
Lazebnik, S., Schmid, C., Ponce, J.: A sparse texture representation using local affine regions. IEEE Trans. Pattern Anal. Mach. Intell. 27(8), 1265–1278 (2005)
Li, Y., Tax, D.M.J., Loog, M.: Supervised scale-invariant segmentation (and detection). In: Proc. Scale Space and Variational Methods in Computer Vision (Scale-Space’11), Ein Gedi, Israel. Lecture Notes in Computer Science, vol. 6667, pp. 350–361. Springer, Berlin (2012)
Lindeberg, T.: Scale-space behaviour of local extrema and blobs. J. Math. Imaging Vis. 1(1), 65–99 (1992)
Lindeberg, T.: Detecting salient blob-like image structures and their scales with a scale-space primal sketch: a method for focus-of-attention. Int. J. Comput. Vis. 11(3), 283–318 (1993)
Lindeberg, T.: Effective scale: a natural unit for measuring scale-space lifetime. IEEE Trans. Pattern Anal. Mach. Intell. 15(10), 1068–1074 (1993)
Lindeberg, T.: On scale selection for differential operators. In: Høgdra, K.H.K.A., Braathen, B. (eds.) Proc. 8th Scandinavian Conf. on Image Analysis, pp. 857–866. Norwegian Society for Image Processing and Pattern Recognition, Tromsø (1993)
Lindeberg, T.: Scale-space theory: a basic tool for analysing structures at different scales. J. Appl. Stat. 21(2), 225–270 (1994). Also available from. http://www.csc.kth.se/~tony/abstracts/Lin94-SI-abstract.html
Lindeberg, T.: Scale-Space Theory in Computer Vision. The Kluwer International Series in Engineering and Computer Science. Springer, Berlin (1994)
Lindeberg, T.: Direct estimation of affine deformations of brightness patterns using visual front-end operators with automatic scale selection. In: Proc. 5th Int. Conf. on Computer Vision, Cambridge, MA, pp. 134–141 (1995)
Lindeberg, T.: Linear spatio-temporal scale-space. In: ter Haar Romeny, B.M., Florack, L.M.J., Koenderink, J.J., Viergever, M.A. (eds.) Scale-Space Theory in Computer Vision: Proc. First Int. Conf. Scale-Space’97, Utrecht, The Netherlands. Lecture Notes in Computer Science, vol. 1252, pp. 113–127. Springer, Berlin (1997). Extended version available as technical report ISRN KTH NA/P–01/22–SE from KTH
Lindeberg, T.: Edge detection and ridge detection with automatic scale selection. Int. J. Comput. Vis. 30(2), 117–154 (1998)
Lindeberg, T.: Feature detection with automatic scale selection. Int. J. Comput. Vis. 30(2), 77–116 (1998)
Lindeberg, T.: A scale selection principle for estimating image deformations. Image Vis. Comput. 16(14), 961–977 (1998)
Lindeberg, T.: Principles for automatic scale selection. In: Handbook on Computer Vision and Applications, pp. 239–274. Academic Press, Boston (1999). Also available from http://www.csc.kth.se/cvap/abstracts/cvap222.html
Lindeberg, T.: Scale-space. In: Wah, B. (ed.) Encyclopedia of Computer Science and Engineering, pp. 2495–2504. Wiley, Hoboken (2008). doi:10.1002/9780470050118.ecse609. Also available from http://www.nada.kth.se/~tony/abstracts/Lin08-EncCompSci.html
Lindeberg, T.: Generalized scale-space interest points: scale-space primal sketch for differential descriptors. Int. J. Comput. Vis. (2010) (original version submitted in June 2010)
Lindeberg, T.: Generalized Gaussian scale-space axiomatics comprising linear scale-space, affine scale-space and spatio-temporal scale-space. J. Math. Imaging Vis. 40(1), 36–81 (2011)
Lindeberg, T.: Scale invariant feature transform. Scholarpedia 7(5), 10491 (2012)
Lindeberg, T.: Distinctiveness and matching properties of generalized scale-space interest points (2012). Unpublished manuscript
Lindeberg, T.: Scale Selection. Encyclopedia of Computer Vision. Springer, Berlin (2012, in press)
Lindeberg, T., Akbarzadeh, A., Laptev, I.: Galilean-corrected spatio-temporal interest operators. In: International Conference on Pattern Recognition, Cambridge, pp. I:57–62 (2004)
Lindeberg, T., Fagerström, D.: Scale-space with causal time direction. In: Proc. ECCV’96, Cambridge, UK, vol. 1064, pp. 229–240. Springer, Berlin (1996)
Lindeberg, T., Gårding, J.: Shape-adapted smoothing in estimation of 3-D depth cues from affine distortions of local 2-D structure. Image Vis. Comput. 15, 415–434 (1997)
Loog, M., Li, Y., Tax, D.: Maximum membership scale selection. In: Multiple Classifier Systems. Lecture Notes in Computer Science, vol. 5519, pp. 468–477. Springer, Berlin (2009)
Lowe, D.: Distinctive image features from scale-invariant keypoints. Int. J. Comput. Vis. 60(2), 91–110 (2004)
Mikolajczyk, K., Schmid, C.: Scale and affine invariant interest point detectors. Int. J. Comput. Vis. 60(1), 63–86 (2004)
Mikolajczyk, K., Tuytelaars, T., Schmid, C., Zisserman, A., Matas, J., Schaffalitzky, F., Kadir, T., van Gool, L.: A comparison of affine region detectors. Int. J. Comput. Vis. 65(1–2), 43–72 (2005)
Mrázek, P., Navara, M.: Selection of optimal stopping time for nonlinear diffusion filtering. Int. J. Comput. Vis. 52(2–3), 189–203 (2003)
Negre, A., Braillon, C., Crowley, J.L., Laugier, C.: Real-time time-to-collision from variation of intrinsic scale. Exp. Robot. 39, 75–84 (2008)
Pedersen, K.S., Nielsen, M.: The Hausdorff dimension and scale-space normalisation of natural images. J. Math. Imaging Vis. 11(2), 266–277 (2000)
Sato, Y., Nakajima, S., Shiraga, N., Atsumi, H., Yoshida, S., Koller, T., Gerig, G., Kikinis, R.: 3D multi-scale line filter for segmentation and visualization of curvilinear structures in medical images. Med. Image Anal. 2(2), 143–168 (1998)
Shi, J., Tomasi, C.: Good features to track. In: Proc. CVPR, pp. 593–600 (1994)
Sporring, J., Colios, C.J., Trahanias, P.E.: Generalized scale-selection. In: Proc. International Conference on Image Processing (ICIP’00), Vancouver, Canada, pp. 920–923 (2000)
Tuytelaars, T., van Gool, L.: Matching widely separated views based on affine invariant regions. Int. J. Comput. Vis. 59(1), 61–85 (2004)
Tuytelaars, T., Mikolajczyk, K.: A survey on local invariant features. In: Foundations and Trends in Computer Graphics and Vision, vol. 3(3). Now Publishers, Boston (2008)
Uffink, J.: Can the maximum entropy principle be explained as a consistency requirement? Stud. Hist. Philos. Mod. Phys. 26(3), 223–261 (1995)
Weickert, J., Ishikawa, S., Imiya, A.: Linear scale-space has first been proposed in Japan. J. Math. Imaging Vis. 10(3), 237–252 (1999)
Willems, G., Tuytelaars, T., van Gool, L.: An efficient dense and scale-invariant spatio-temporal interest point detector. In: Proc. ECCV’08, Marseille, France. Lecture Notes in Computer Science, vol. 5303, pp. 650–663. Springer, Berlin (2008)
Witkin, A.P.: Scale-space filtering. In: Proc. 8th Int. Joint Conf. Art. Intell, Karlsruhe, Germany, pp. 1019–1022 (1983)
Acknowledgements
I would like to thank the anonymous reviewers for valuable comments and questions that improved the presentation and Oskar Linde for valuable comments on an early version of the manuscript.
Open Access
This article is distributed under the terms of the Creative Commons Attribution License which permits any use, distribution, and reproduction in any medium, provided the original author(s) and the source are credited.
Author information
Authors and Affiliations
Corresponding author
Additional information
The support from the Swedish Research Council, Vetenskapsrådet (contracts 2004-4680, 2010-4766) and from the Royal Swedish Academy of Sciences as well as the Knut and Alice Wallenberg Foundation is gratefully acknowledged.
Appendix
Appendix
1.1 A.1 On the Algorithmic Advantages of Post-smoothing for Scale Linking
In [39] a generalized notion of a scale-space primal sketch for differential descriptors was introduced, where pointwise image features at different scales are linked into feature trajectories over scale and bifurcation events between these feature trajectories are explicitly registered. Specifically, it was experimentally shown that:
-
a significance measure obtained by integrating scale-normalized feature responses along each feature trajectory allows for a better ranking of interest points than ranking on the magnitude of the responses of scale-space extrema, and
-
scale selection by weighted averaging over scale allows for interest point detection with better repeatability properties under affine and perspective image deformations compared to scale selection from local extrema over scale of scale-normalized derivatives.
In the original work on a scale-space primal sketch for intensity data (as obtained from zero-order scale-space operations without derivative computations) [27, 31] a scale linking algorithm was proposed based on (i) the detection of grey-level blobs at any level of scale and (ii) adaptive scale sampling refinements. By theoretical analysis of singularities in scale-space, the generic types of blob events in scale-space were classified [26]. Specifically, the theoretical analysis showed that although the local drift velocity in scale-space may momentarily tend to infinity near bifurcation events, it can be regarded as unlikely that an extremum point moves outside the support region of the grey-level blob. For this reason, the matching of image structures over scales used in the scale linking algorithm was based on detecting overlaps between the support regions of the grey-level blobs at adjacent scales, and local refinements were performed if the relations between partially overlapping grey-level blobs could not be decomposed into the generic types of blob events. Experimentally, it was shown that this approach allowed for extraction of intuitively reasonable image structures based on very few assumptions. Due to the adaptive scale refinements and the explicit computation of grey-level blobs, this type algorithm does, however, not appear suitable for real-time implementation on a regular processor.
In [39], a simplified and more efficient type of scale linking algorithm was proposed, where scale refinements and explicit detection of grey-level blobs are avoided. In order to still be able to make use of the highly useful property that a local extremum can be expected to be unlikely to drift outside the support region of the grey-level blob, a local descent/ascent search is instead initiated at the position corresponding to the local extrema at the adjacent scale. If the descent/ascent search is initiated within the support region of a grey-level blob, this procedure should therefore proceed towards the extremum. This approach therefore avoids the complexity problems that otherwise would occur if matching a large number of image features between adjacent scale levels.
When computing non-linear expressions from image data at, in particular fine or moderate scales, however, it turns out that one may get several local extrema of low relative amplitude in relation to neighbouring local extrema, which do not correspond to perceptually relevant image structures. Since such local perturbations cannot be expected to be stable under natural imaging conditions, they cannot be expected to be perceptually or algorithmically useful. By performing a small amount of additional Gaussian smoothing to the computed non-linear differential expression, a large number of such spurious responses can be suppressed (see Fig. 6). Thereby, the task of scale linking will be simplified for the scale linking algorithm. Due to the suppression of a large number of irrelevant features, the scale linking algorithm will also run significantly faster. Experimentally, the repeatability properties of the resulting interest points do also become better.

Illustration of the effect of post-smoothing: The left figure shows extrema of the differential expression \({\mathcal{D}}_{1,\mathit{norm}} L\) computed from an image detail at scale t=4 without post-smoothing. The right figure shows extrema of the same differential expression with complementary post-smoothing using c=3/8. As can be seen from this figure, the use of post-smoothing can reduce the number of multiple responses to similar structures in the image domain. Observe that this operation is conceptually different from changing the scale at which derivatives are computed, since the post-smoothing is performed after the computation of the non-linear differential expression
From scale invariance arguments it is natural to let the relation between the post-smoothing scale t post and the local scale level for computing derivatives t be given by
for some fixed value of the relative post-smooth scale parameter c. In our first work on generalized scale-space interest points [39], we used c=1/2 when linking image structures over scale into feature trajectories. Specifically, the experiments reported in Sect. 5.3 were performed using c=1/2. In connection with our more recent work on integrating the generalized scale-space interest points with local image descriptors [42], we found that c≈3/8 is a better choice when matching image descriptors under affine and perspective image deformations. Increasing c above c=1/2 decreases the repeatability properties for image deformations outside the similarity group, whereas decreasing c below c=1/4 leads to a lower suppression of irrelevant features which affects the repeatability properties of the resulting interest points. Beyond this, we have not tried to optimize the performance, bearing in mind that one could also consider other types of algorithms for scale linking, which could then lead to different trade-offs in terms of the complexity of the local matching step vs. efficiency or accuracy considerations.
1.2 A.2 3-D Generalizations of the Scale-Space Interest Point Detectors
For image data f:ℝ3→R that are defined over a three-dimensional image domain indexed by the image coordinates (x,y,z), there are natural ways to extend the interest point detectors considered in this work based on the scale-space representation L:ℝ3×ℝ+→ℝ of f generated by convolution with the three-dimensional Gaussian kernel
using
-
the Laplacian operator
$$ \nabla^2_{\gamma-\mathit{norm}} L = t^{\gamma} \, \operatorname {trace}{\mathcal{H}} L = t^{\gamma} \, (L_{xx} + L_{yy} + L_{zz}) $$(173) -
the determinant of the Hessian
 (174)
(174) -
the rescaled Gaussian curvature
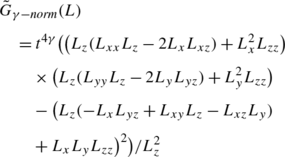 (175)
(175) -
the unsigned Hessian feature strength measure I
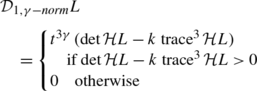 (176)
(176) -
the unsigned Hessian feature strength measure II
$$ {\mathcal{D}}_{2,\gamma-\mathit{norm}} L = t^{\gamma} \, \min \bigl(\vert \lambda_1\vert , \vert \lambda_2\vert , \vert \lambda_3\vert \bigr) $$(177)


where λ 1, λ 2 and λ 3 denote the eigenvalues of the three-dimensional Hessian matrix \({\mathcal{H}} L\), whereas \(G_{\gamma-\mathit{norm}}(L)/\allowbreak(L_{x}^{2}+L_{y}^{2}+L_{z}^{2})^{2}\) denotes the Gaussian curvatureFootnote 7 of a level surface.
Related Work
In relation to these 3-D extensions of the 2-D interest point detectors considered in this work, a three-dimensional extension of the Harris operator
defined from the three-dimensional second-moment matrix

has been previously demonstrated to be effective for detecting sparse spatio-temporal interest points in video data (Laptev and Lindeberg [23]). The three-dimensional Hessian feature strength measure \({\mathcal{D}}_{1,\gamma-\mathit{norm}} L\) can be seen as a differential analogue to the spatio-temporal Harris operator, defined from second-order derivatives of image intensities only, which should allow for the computation of more dense sets of interest points, in analogy with the denser sets of interest points that are obtained from the 2-D Hessian feature strength measure \({\mathcal{D}}_{1,\gamma-\mathit{norm}} L\) compared to the interest points detected by the 2-D Harris operator. For 3-D image data, the parameter k should be in the interval \(]0, \frac{1}{27}[\).
Also, the spatio-temporal determinant of the Hessian has been used for detecting spatio-temporal interest points (Willems et al. [61]) and been demonstrated to allow for denser sets of spatio-temporal interest points than the spatio-temporal Harris operator. The new 3-D interest point detectors \({\mathcal{D}}_{1,\gamma-\mathit{norm}} L\), \({\mathcal{D}}_{2,\gamma-\mathit{norm}} L\) and \(\tilde{G}_{\gamma-\mathit{norm}}(L)\) provide a way to extend this repertoire of 3-D interest point detectors. When applying these operators to spatio-temporal image data, they should be combined with a spatio-temporal scale-space representation (Lindeberg [33, 40]; Lindeberg and Fagerström [45]) that allows for different scale parameters over the space vs. time. Moreover, the specific coupling between space and time should be explicitly considered when expressing invariance properties over space-time (Lindeberg et al. [40, 44]).
In the following, we shall analyze the scale-selection properties of these 3-D interest point detectors when applied to volumetric (spatial) image data using the same amount of scale-space smoothing over all spatial dimensions.
1.2.1 A.2.1 Scale Selection Properties for a 3-D Gaussian Blob
Consider a single 3-D Gaussian blob
Due to the semi-group property of the Gaussian kernel
the scale-space representation of f obtained by Gaussian smoothing is given by

1.2.2 A.2.2 The Pure Second-Order Interest Point Detectors
By differentiation it follows the scale normalized feature strength measure at the center (x,y,z)=(0,0,0) of the Gaussian blob will for the Laplacian (173), the determinant of the Hessian (174) and the Hessian feature strength measures I (176) and II (177) be given by


Differentiating these expressions with respect to the scale parameter t and setting the derivative to zero gives that the extremum over scale will for all these interest point detectors be assumed at the same scale
If we would like these interest point detectors to return a scale estimate corresponding to the scale parameter of a Gaussian blob, we should therefore choose
Using γ=1 would otherwise lead to a lower scale estimate
For scale selection based on weighted averaging over scale of the scale-normalized Laplacian response (183), the corresponding scale estimates are for \(\gamma \in ]0, \frac{5}{2}[\) given by

where ψ(u) denotes the digamma function, which is the logarithmic derivative of the Gamma function ψ(u)=Γ′(u)/Γ(u).
Similarly, from the explicit expression for the determinant of the Hessian at the center of the Gaussian blob (184), it follows that the weighted scale estimate will for \(\gamma \in ]0, \frac{5}{2}[\) be given by

Due to the similarity between the explicit expressions for the Hessian feature strength measure I (185) and the determinant of the Hessian response (184) as well as the similarity between the Hessian feature strength measure II (186) and the Laplacian response (185) at the center of a Gaussian blob, the scale estimates for \({\mathcal{D}}_{1,\gamma-\mathit{norm}} L\) and \({\mathcal{D}}_{2,\gamma-\mathit{norm}} L\) will be analogous:


When expressed in terms of the regular scale parameter
the weighted scale selection method does hence for a rotationally symmetric Gaussian blob lead to similar scale estimates as are obtained from local extrema over scale of γ-normalized derivatives (29) when γ=5/4. For other values of γ, the scale estimates are biased
by a scale factor equal to
for the Laplacian \(\nabla_{\mathit{norm}}^{2} L\) and the Hessian feature strength measure \({\mathcal{D}}_{2,\mathit{norm}} L\) operators, and a bias factor
for the determinant of the Hessian \(\det {\mathcal{H}}_{\mathit{norm}} L\) and the Hessian feature strength measure \({\mathcal{D}}_{1,\mathit{norm}} L\) operators.
By following the methodology outlined in Sects. 3.2, 3.3, 4.2 and 4.3, a corresponding more detailed analysis can be performed concerning the influence of the post-smoothing operation and affine image deformations for these 3-D interest point detectors.
1.2.3 A.2.3 The Rescaled Gaussian Curvature Operator
When computing the rescaled Gaussian curvature \(\tilde{G}_{\gamma-\mathit{norm}}(L)\) for the scale-space representation of a three-dimensional spherically symmetric Gaussian blob with scale parameter t 0, we obtain
which with spherical coordinates x 2+y 2+z 2=R 2 becomes
This expression assumes its maximum value over R when
for which the rescaled surface curvature assumes the value
Setting the derivative of this expression with respect to the scale parameter to zero gives
for which the γ-normalized magnitude response is
A corresponding analysis can be carried out for the Gaussian curvature modulated by other powers of the gradient magnitude
where a<2. Then, the corresponding scale estimate becomes
For general values of a, the corresponding intermediate results are, however, more complex.
1.3 A.3 Interpreting the Parameter γ in Terms of the Dimensionality of the Image Features
The value γ=5/4 obtained from the analysis of a 3-D Gaussian blob in Appendix A.2.2 (Eq. (188)) can be compared to the values obtained by requiring the purely second-order differential entities to respond to a 2-D Gaussian blob at t=t 0 (Eq. (29))
or the value of the γ parameter obtained by requiring the second-order derivative operator to respond to a 1-D Gaussian blob (alternatively a 1-D Gaussian ridge embedded in a higher-dimensional space) at t=t 0 [34]
More generally, for a D-dimensional Gaussian intensity profile
embedded in N≥D dimensions, the scale-space representation is given by

with the corresponding γ-normalized Laplacian response

which assumes the following value at the origin
Differentiating this expression with respect to t gives and setting the derivative to zero gives
Requiring this scale estimate to be equal to t 0 implies that the γ-value for a pure second-order operator should therefore be related to the dimensionality D of the image features they should respond to according to
Note that the 2-D case is special in the sense that only for this dimensionality D=2 does scale selection based on the most scale-invariant choice γ=1 lead to scale estimates that are equal to the diffuseness parameter t 0 of a Gaussian intensity profile.
It can also be noted that only for two-dimensional blobs will the corresponding γ-normalized magnitude values of scale-space extrema be independent of the size of the blob, whereas in other dimensionalities the corresponding magnitude values need to be normalized by a scale-dependent correction factor \(\hat{t}^{1-\gamma}\) to lead to scale-invariant magnitude values that are independent of the diffuseness t 0 of the D-dimensional Gaussian intensity profile.
Rights and permissions
Open Access This article is distributed under the terms of the Creative Commons Attribution 2.0 International License (https://creativecommons.org/licenses/by/2.0), which permits unrestricted use, distribution, and reproduction in any medium, provided the original work is properly cited.
About this article
Cite this article
Lindeberg, T. Scale Selection Properties of Generalized Scale-Space Interest Point Detectors. J Math Imaging Vis 46, 177–210 (2013). https://doi.org/10.1007/s10851-012-0378-3
Published:
Issue Date:
DOI: https://doi.org/10.1007/s10851-012-0378-3